0404
Concurrent laminar CBF, CBV, T2-BOLD and CMRO2 fMRI at 7T in human primary motor cortex1Laboratory of FMRI Technology (LOFT), Mark & Mary Stevens Neuroimaging and Informatics Institute, Keck School of Medicine, University of Southern California, Los Angeles, CA, United States, 2Department of Radiology, Johns Hopkins University School of Medicine, Baltimore, MD, United States
Synopsis
In this study, we propose a novel pulse sequence to simultaneously acquire laminar ASL, VASO and T2-BOLD signals with high spatial resolution. Experiments were performed on the M1 to characterize concurrent layer-dependent CBF, CBV, T2 BOLD and CMRO2 signal changes to sensory input and motor output. Both positive CBF/CBV/CMRO2 and negative VASO profiles show a clear ‘double-peak’ pattern, which is consistent with the hypothesis that FT engages neural activity of somatosensory input in the superficial layers and motor output in the deep layers. The BOLD response mainly peaked in superficial layers due to dominant contribution of pial veins.
Background
Simultaneous acquisition of laminar cerebral blood flow (CBF), cerebral blood volume (CBV), blood-oxygenation-level-dependent (BOLD) and cerebral metabolic rate of oxygen (CMRO2) signals would be a valuable tool for fMRI studies to investigate hemodynamic and metabolic activities of neural circuits across cortical layers1. Ultrahigh field arterial spin labeling (ASL) has the dual benefits of long tracer half-life determined by blood T1 and high SNR2-3. The feasibility of cortical layer-dependent perfusion imaging has been demonstrated using zoomed pseudo-continuous arterial spin labeling (pCASL) at 7T4. In this study, we propose a novel pulse sequence to simultaneously acquire ASL CBF, vascular space occupancy (VASO)5 and T2-BOLD signals with high spatial resolution. Experiments were performed on the primary motor cortex (M1) to characterize concurrent layer-dependent CBF, CBV, T2-BOLD and CMRO2 signals changes to sensory input and motor output.Method
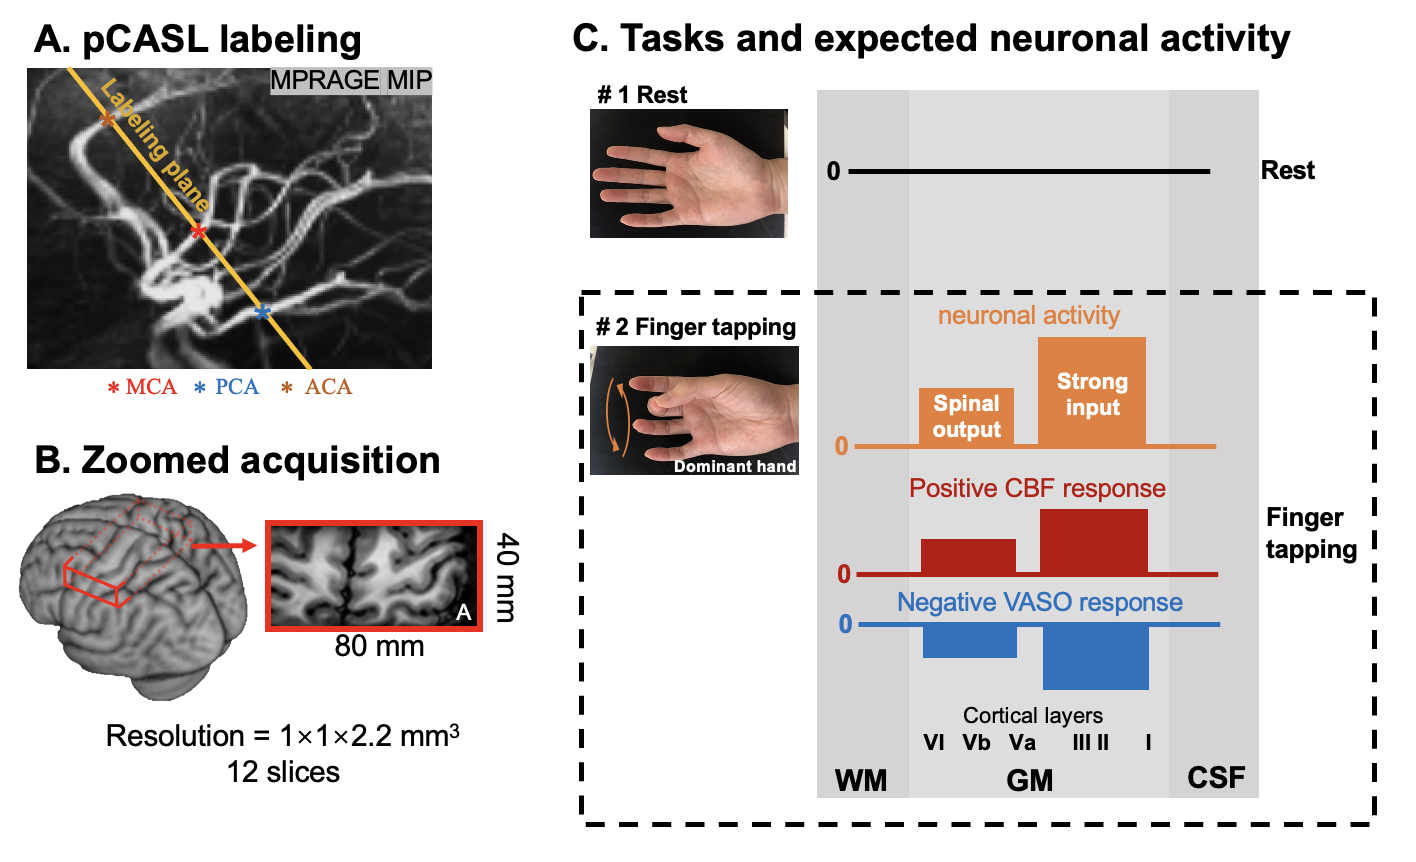
Four subjects (3male, age=25.3±3.2years) underwent MRI scans on a Siemens 7T Terra scanner with a NOVA 1Tx/32Rx head coil. Sequence diagram for concurrent CBF/VASO/BOLD measurement is shown in Fig.1A. A non-selective HS-inversion pulse (efficiency=87%6) was added after pCASL pulse train to suppress background signal and generate VASO contrast. Due to limited B1+ at bottom of brain at 7T, we assume fresh in-flow blood only experience one inversion and control images acquired at post-labeling delay (PLD)=1160msec, which nulls in-flow blood signal (T1,blood=2.1sec), exhibit VASO contrast. The PLD=1160msec is slightly longer than arterial transit time in M1 and optimal for functional ASL study4. Concurrent T2-BOLD signals were acquired 500 msec after the ASL/VASO acquisition (Fig.1A).Intracranial vasculature was revealed by maximal-intensity-projection (MIP) of the MP2RAGE (0.7mm3) images, and the pCASL labeling plane was placed above the circle of Willis (CoW) and perpendicular to the M3 branch of middle cerebral artery (MCA) (Fig.2A). Gradient-and-spin-echo (GRASE) readout with inner-volume excitation was used to acquire a zoomed imaging volume covering the motor cortex of the dominant-hand (Fig. 2B). This labeling location took advantage of the higher B1 and more homogeneous B0 field around the center of the brain. Imaging parameters were: FOV=80×40mm2, 14 slices, 1-mm2 in-plane resolution, 2.2mm slice thickness, 3 segments along phase direction, TE=17.2msec, labeling duration=1280msec, TR=4000msec. Volume TR was 24 sec for one CBF and VASO image, and 12 sec for one BOLD image (Fig.1B).
Four task runs with interleaved blocks of rest and sequential dominant-hand finger-tapping (FT) were acquired (Fig.2C). Each run consisted of five blocks of interleaved rest and FT tasks (48sec per block, TA=8min, Fig.1B). Total scan time=32min. As shown in Fig.2C, we expect FT to induce neuronal activity in both superficial layers (sensory input from primary sensory cortex (S1) and premotor cortex) and deep layers (spinal output), and increased CBF and decreased VASO signals in both deep and superficial layers.
Fifteen cortical layers of M1 were segmented from control images using LAYNII7. Control and label images were subtracted to obtain perfusion images and CBF was calculated8 with labeling efficiency = 82.1%4. VASO signals were divided by BOLD signals to minimize vein contamination (VASOBOLD)5. CBV and CMRO2 changes were calculated from ASL/VASO/BOLD signals according to Lu et al9.
Results and discussion
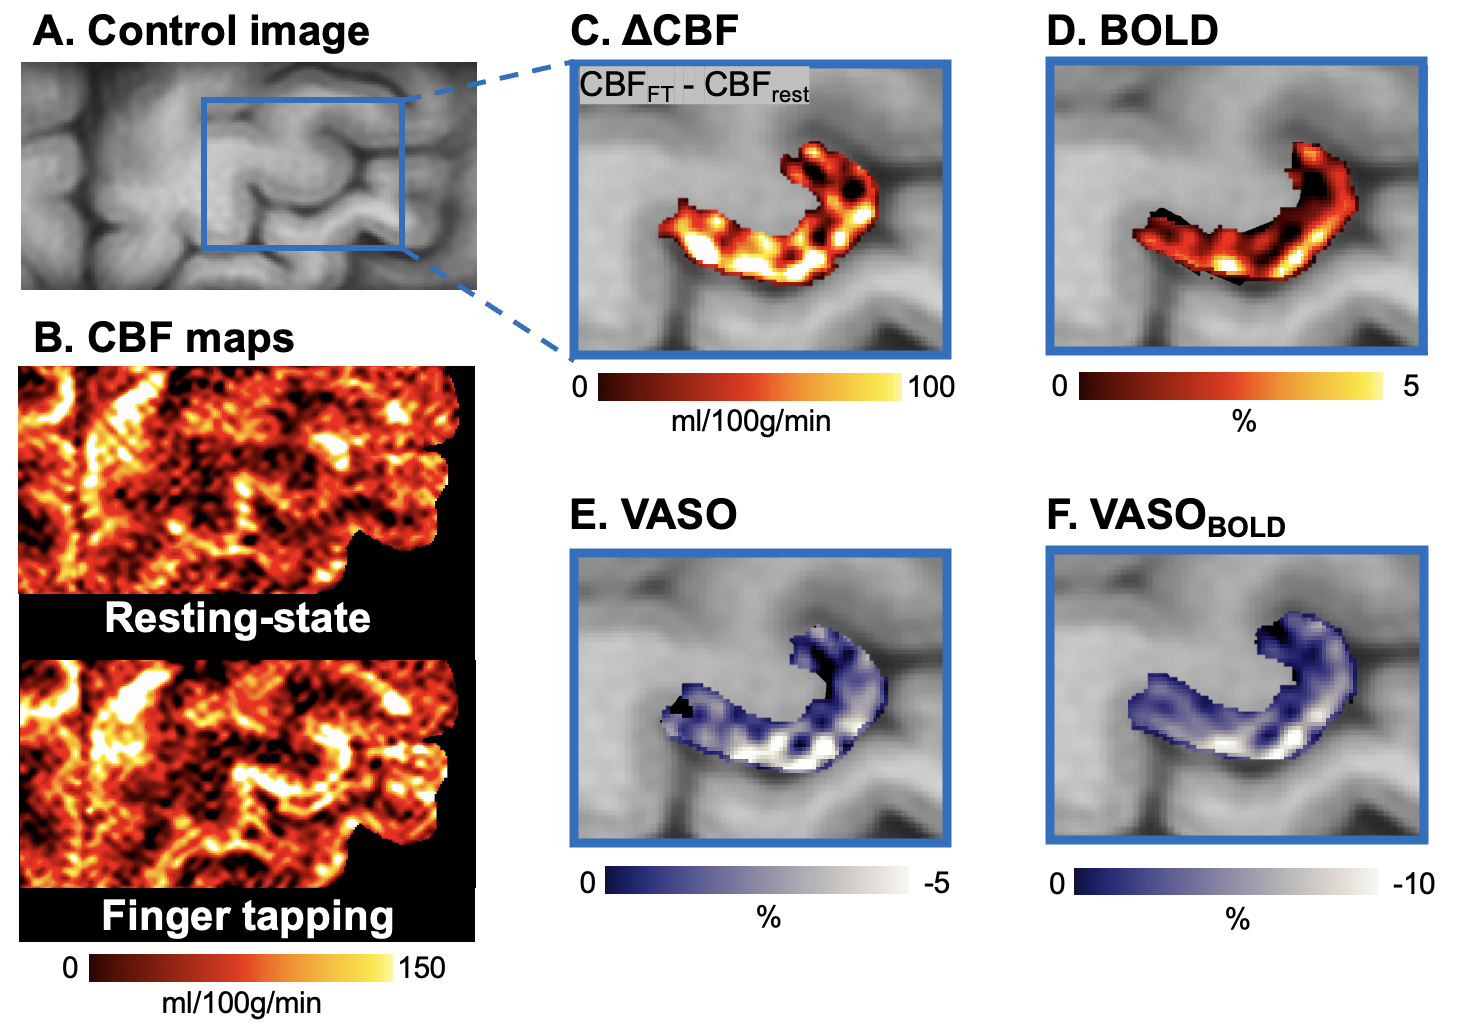
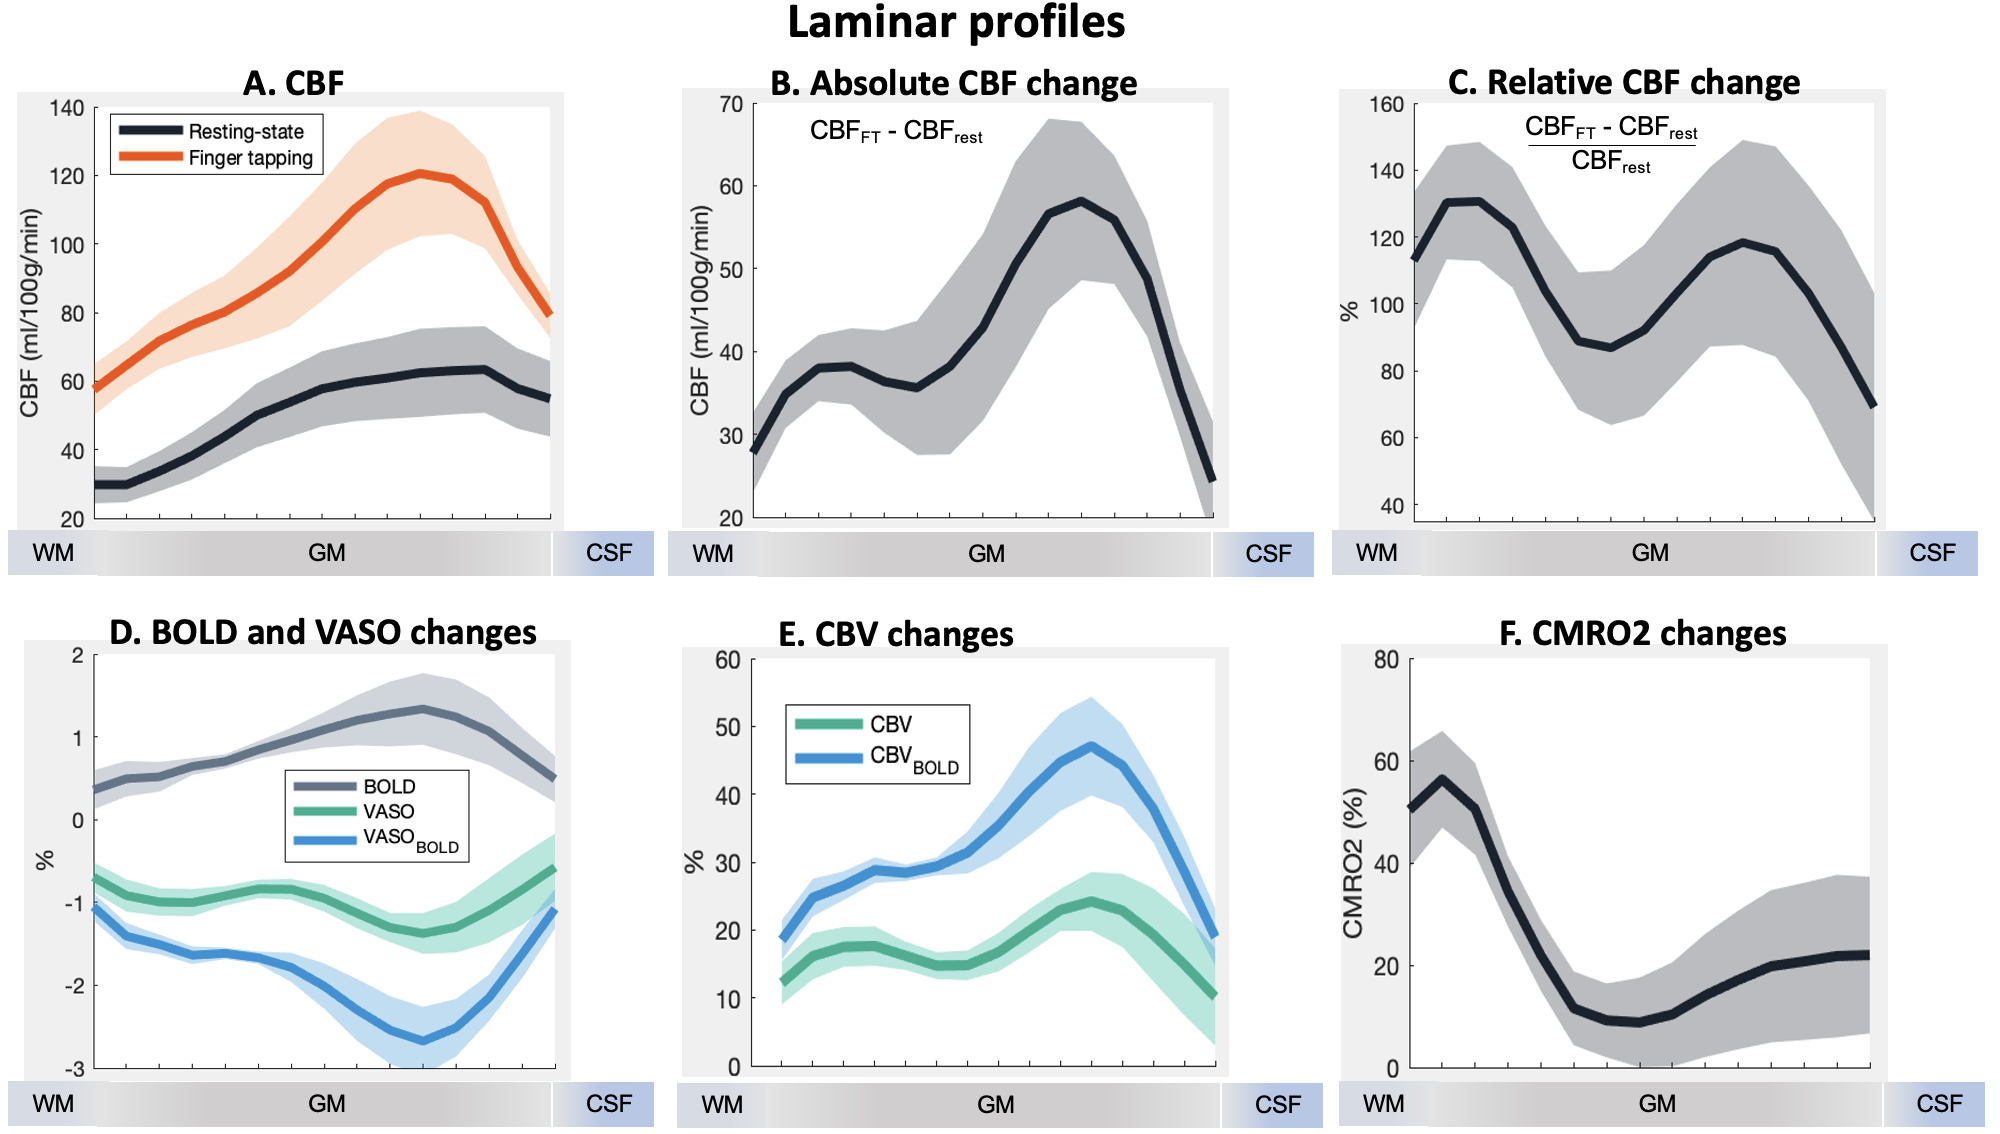
Fig. 3 shows control image (A) and CBF maps at rest and FT (B). FT-induced CBF, BOLD, VASO and VASOBOLD signal changes are highlighted in four insets Fig. 3 C-F, respectively. Positive CBF and BOLD signal changes and negative VASO and VASOBOLD signal changes can be observed along omega-shaped M1 hand-knob.Fig. 4 shows laminar profiles obtained from four subjects. Fig. 4A shows the laminar profile of CBF at rest and FT task. Fig. 4 B-C show the laminar profile of absolute and relative CBF changes evoked by FT. Fig. 4D shows the laminar profile of FT-induced BOLD, VASO and VASOBOLD signal changes. Fig. 4E,F show the laminar profile of CBV and CMRO2 changes. Both positive CBF/CBV/CMRO2 and negative VASO and VASOBOLD profiles show a clear ‘double-peak’ pattern, which is consistent with the hypothesis that FT engages neural activity of somatosensory input in the superficial layers and motor output in the deep layers (Fig. 2C)5. The BOLD response mainly peaked in superficial layers due to dominant contribution of pial veins.
These results demonstrate that the proposed method can resolve layer-dependent input and output activity in human M1 with concurrent CBF, CBV, T2-BOLD and CMRO2 measurements. On average, FT induced 105.3±8.9% CBF increase, 1.8±0.3% VASOBOLD decrease, 0.9±0.2% T2-BOLD increase, 32.3±4.5% CBV increase (VASOBOLD) and 24.6±7.9% CMRO2 increase across cortical layers in M1.
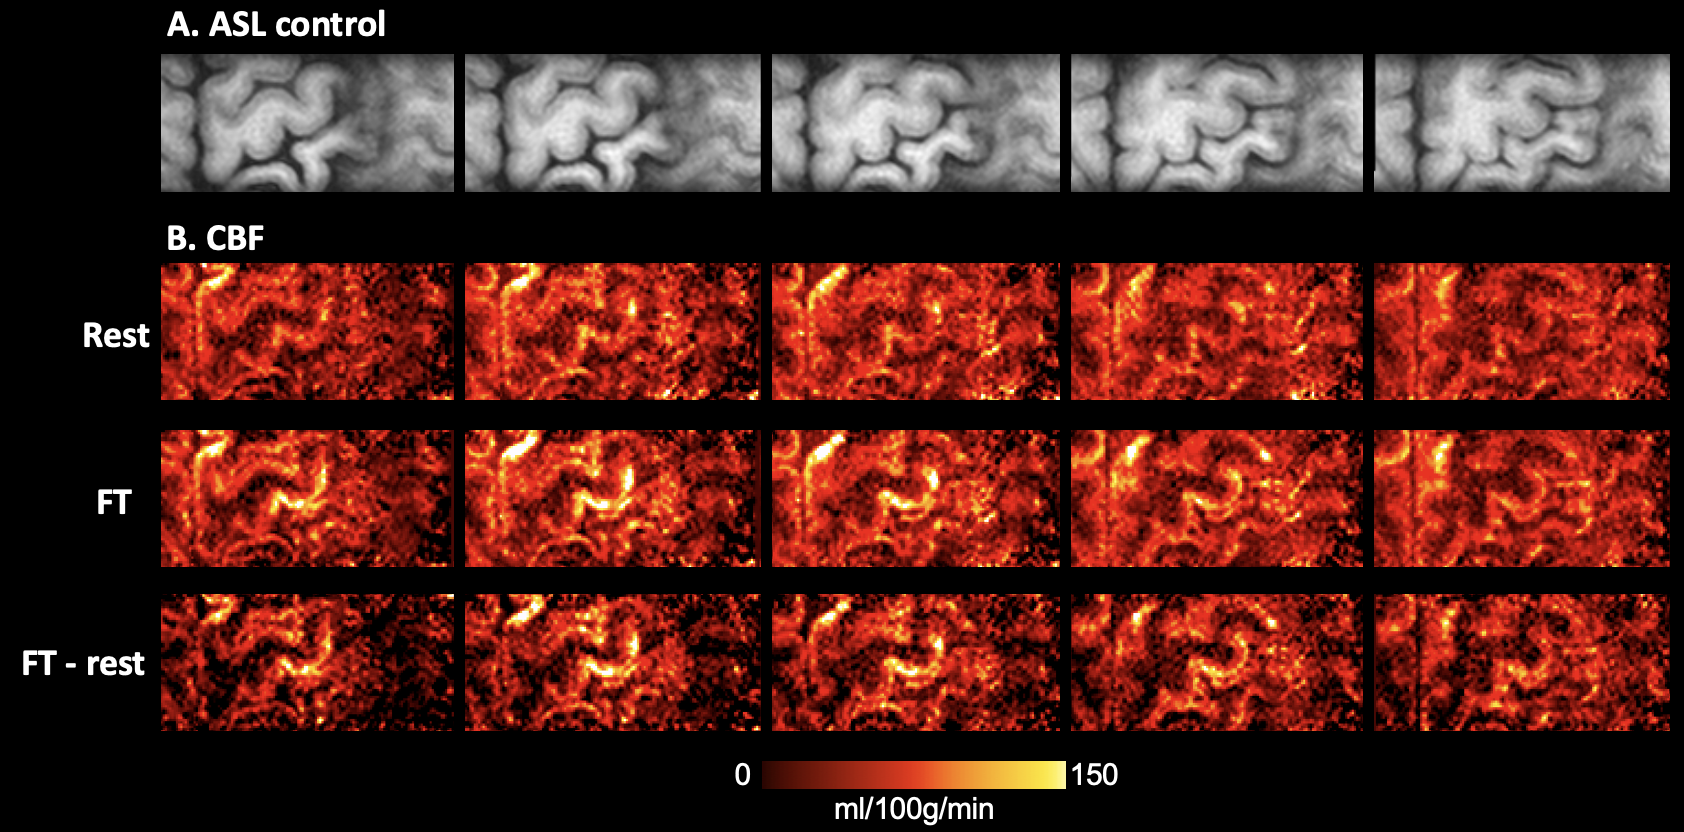
Center five slices of control images, and CBF maps from rest and FT conditions are shown in Fig.5. The proposed technique provides sufficient coverage for M1, premotor and SMA. The proposed method provides sufficient in-plane resolution (1x1mm2) to resolve laminar activities as the thicker slices (2.2mm) are perpendicular to the gyri and sulci of M1.
Conclusion
In-vivo laminar concurrent ASL, VASO and BOLD fMRI was performed at 7T. We demonstrated that the proposed sequence provides quantitative CBF, CBV, BOLD and CMRO2 measurements with high resolution and specificity to detect layer-dependent input and output activity in human M1. We expect many applications of this technique for investigating laminar hemodynamic and metabolic activities.Acknowledgements
This work was supported by National Institute of Health (NIH) grant UH3-NS100614, S10-OD025312, R01-NS114382, R01-EB032169 and R01-EB028297.References
1. Y. Yang, H. Gu, E. A. Stein, Simultaneous MRI acquisition of blood volume, blood flow, and blood oxygenation information during brain activation. Magnetic Resonance in Medicine: An Official Journal of the International Society for Magnetic Resonance in Medicine 52, 1407-1417 (2004).
2. Z. Zuo et al., Turbo-FLASH based arterial spin labeled perfusion MRI at 7 T. PloS one 8 (2013).
3. R. Pohmann, O. Speck, K. Scheffler, Signal‐to‐noise ratio and MR tissue parameters in human brain imaging at 3, 7, and 9.4 tesla using current receive coil arrays. Magnetic resonance in medicine 75, 801-809 (2016).
4. X. Shao et al., Laminar perfusion imaging with zoomed arterial spin labeling at 7 Tesla. bioRxiv (2021).
5. L. Huber et al., High-resolution CBV-fMRI allows mapping of laminar activity and connectivity of cortical input and output in human M1. Neuron 96, 1253-1263. e1257 (2017).
6. K. Wang et al., Optimization of pseudo‐continuous arterial spin labeling at 7T with parallel transmission B1 shimming. Magnetic Resonance in Medicine (2021).
7. L. R. Huber et al., LAYNII: a software suite for layer-fMRI. NeuroImage 237, 118091 (2021).
8. D. C. Alsop et al., Recommended implementation of arterial spin‐labeled perfusion MRI for clinical applications: a consensus of the ISMRM perfusion study group and the European consortium for ASL in dementia. Magnetic resonance in medicine 73, 102-116 (2015).
9. H. Lu, X. Golay, J. J. Pekar, P. C. Van Zijl, Sustained poststimulus elevation in cerebral oxygen utilization after vascular recovery. Journal of Cerebral Blood Flow & Metabolism 24, 764-770 (2004).
Figures