2112
Improved digit selectivity using VASO-CBV in 7T digit motor mapping1Spinoza Centre for Neuroimaging, Amsterdam, Netherlands, 2Experimental and Applied Psychology, VU University, Amsterdam, Netherlands, 3Radiology, University Medical Centre Utrecht, Utrecht, Netherlands, 4Experimental Psychology, Helmholtz Institute, Utrecht University, Utrecht, Netherlands
Synopsis
We used sub-millimeter resolution VASO fMRI at 7T to simultaneously map CBV-VASO and BOLD activation in the sensorimotor and somatosensory cortex during a finger digit mapping task. We reliably showed digit representation maps and quantified digit selectivity for both VASO-CBV and BOLD activations. VASO-CBV demonstrated a higher digit selectivity, confirming the higher spatial specificity of VASO-CBV.
Introduction
Previous BOLD fMRI studies have mapped the representation of digits in the sensorimotor cortex (S1&M1)1–3. Because individual digit movements selectively activate distinct patches of the cortex, it is possible to quantify the degree of selectivity to one digit movement and the relationship of the cortical region to the movement of other digits2,4. There is, however, also overlap due to the limited spatial specificity of the GRE-BOLD responses 5,6. The Vascular Space Occupancy (VASO) method becomes advantageous since it promises higher specificity than BOLD due to reduced draining vein contamination. With this scenario, the fine-scale representation of finger digits (selectivity) is ideal for comparing fMRI specificity of BOLD and VASO-CBV. Here, we simultaneously measured VASO-CBV and BOLD responses, using a double 3D-EPI VASO sequence7,8, during the execution of digit movements. We hypothesize that the higher specificity of VASO-CBV images would result in higher selectivity.Methods
Six healthy volunteers (4 females, age 30±4 years) participated in the study. Imaging was performed on a 7T scanner (Philips) using a 32Rx8Tx coil (Nova Medical). SS-SI VASO data were recorded using a 3D EPI readout [TI1/TI2/TE/TRSS-SIVASO = 1100/2240/24/3000ms] with a nominal 0.79 * 0.79 * 1.5mm voxel size, (FOV=140×140×20mm3, matrix=176×176×13), PF=0.78, SENSEinplane=2.7, volumes=210. The task consisted of flexing one finger from an extended position periodically following a visual cue. Participants performed the same task three times, once for each finger (thumb (D1), index (D2), and little (D5)), with the right hand. The task paradigm consisted of 30 s of baseline alternated with 30s paced flexing-extension 1Hz, repeated ten times, resulting in 10m30s acquisitions per digit. Data processing consisted of motion correction for BOLD and VASO-CBV images separately, followed by a BOLD correction scheme to correct the VASO data for BOLD contamination7. NORDIC PCA denoising9 was used to increase the accuracy of the functional maps10. No additional smoothing or temporal filtering was applied. GLM analysis was done using FSL FEAT (v.6.0). Statistical differences between BOLD and VASO-CBV were assessed using Paired t-tests in R. The ROIs included all voxels in the sensorimotor area with a z-score > 2.5 for at least one digit in VASO-CBV and BOLD data. A winner-take-all approach was used to divide the ROIs into digit clusters. Overall selectivity (Equation 1) provided a general estimation of selectivity within the S1&M1 ROI. For the digit selectivity, equation 2 was used to quantify the selectivity of each digit.In addition, DICE and Jaccard similarity coefficients were used to compare the spatial extent of overlap between pairs of digit clusters.$$ Overall Selectivity= (max(D1,D2,D5))/(∑(D1,D2,D5)) [1]$$
$$ Digit Selectivity (D1)= (((D1-D2)+(D1-D5))⁄2)/D1 [2]$$
Results & Discussion
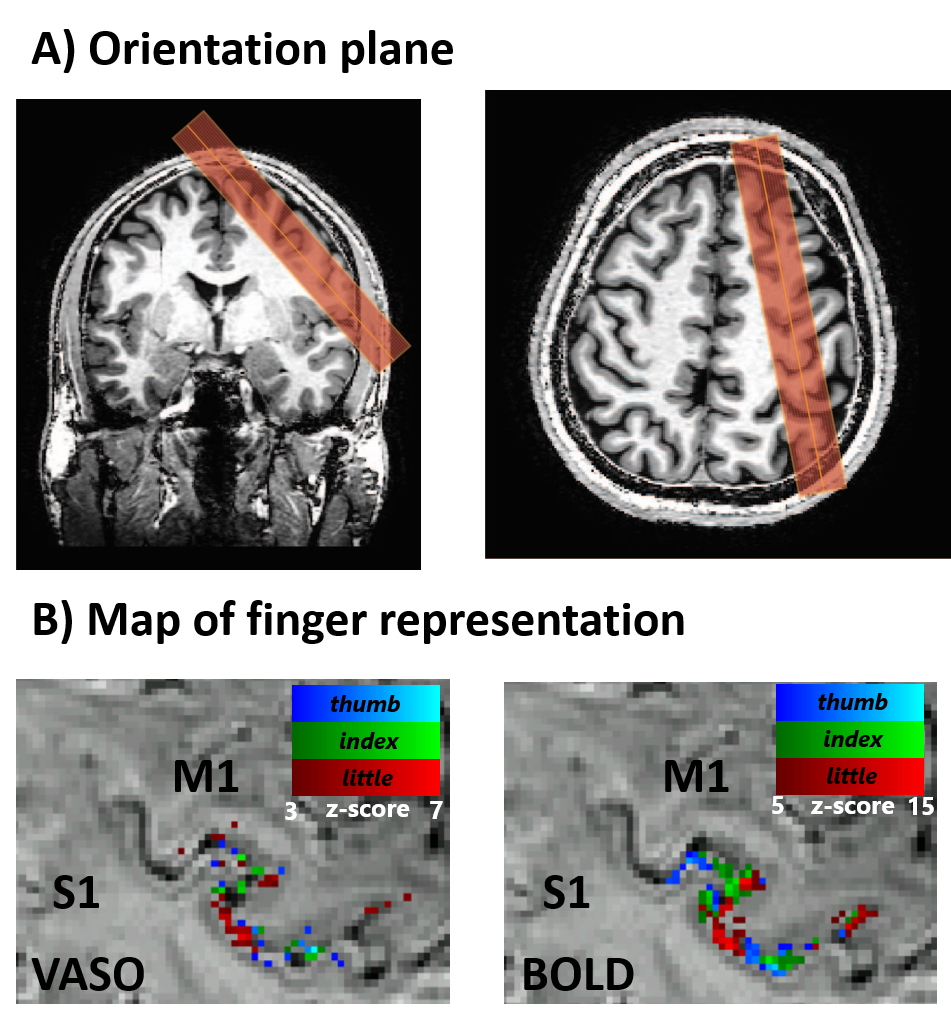
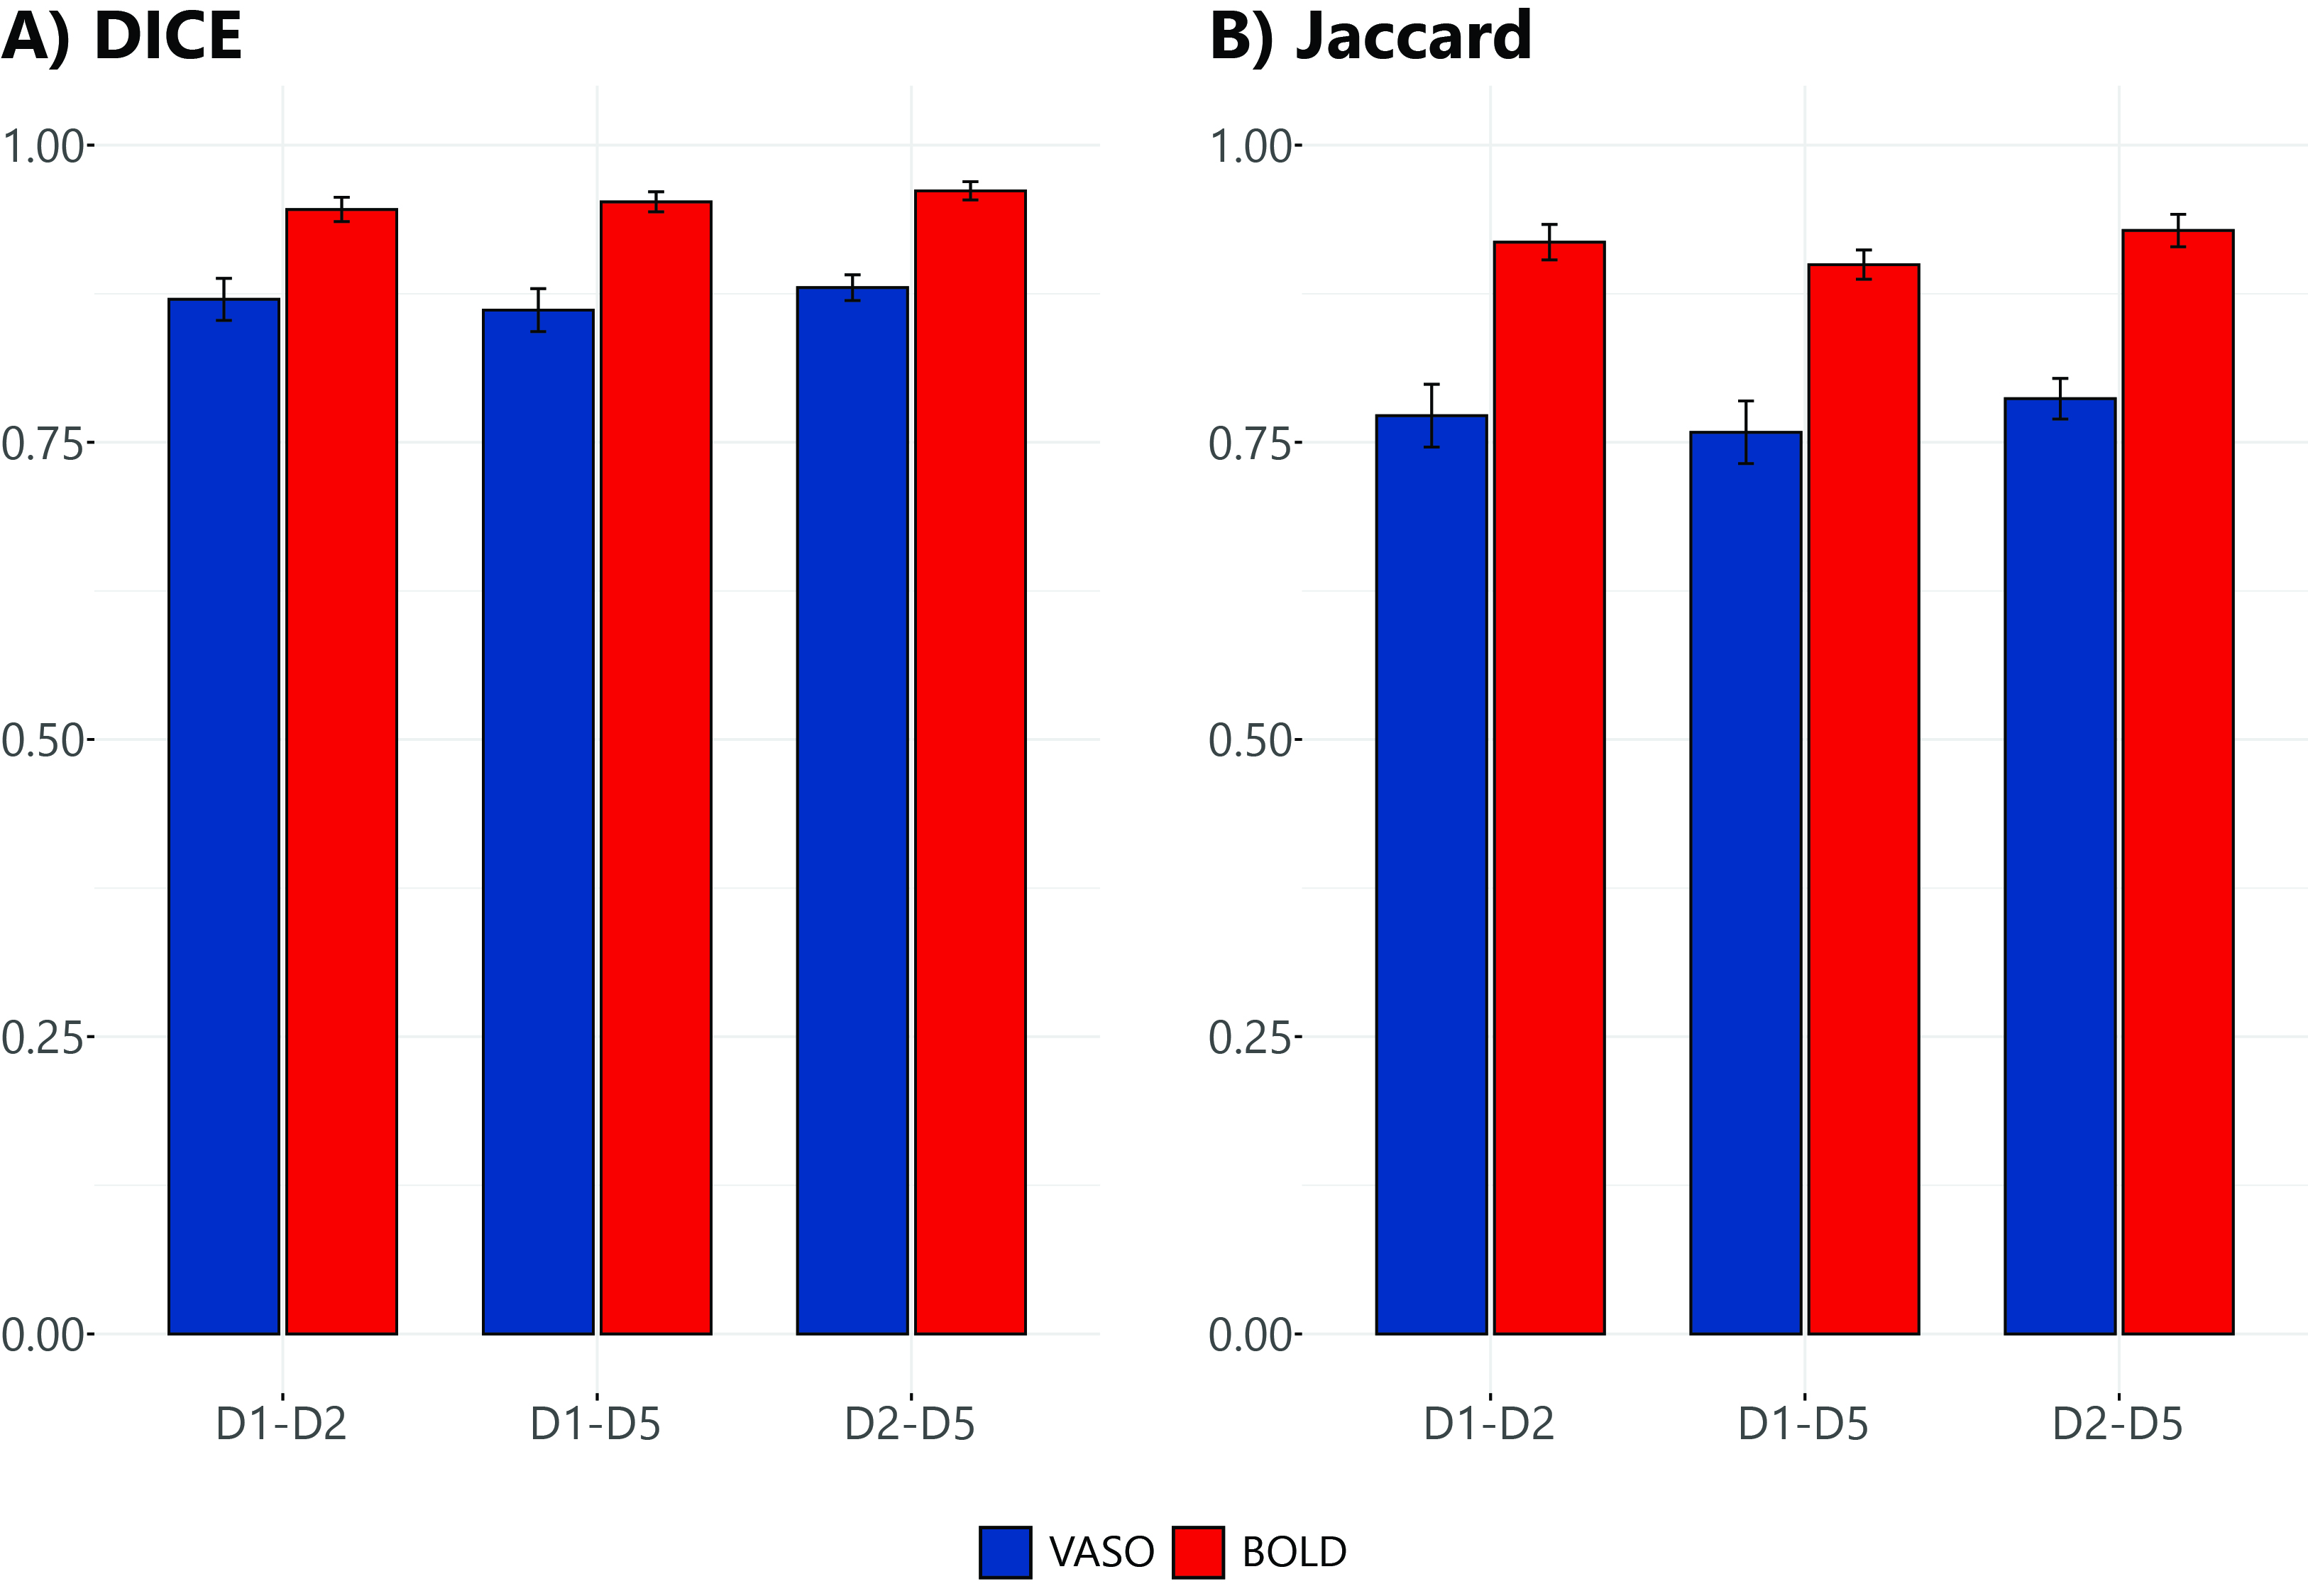
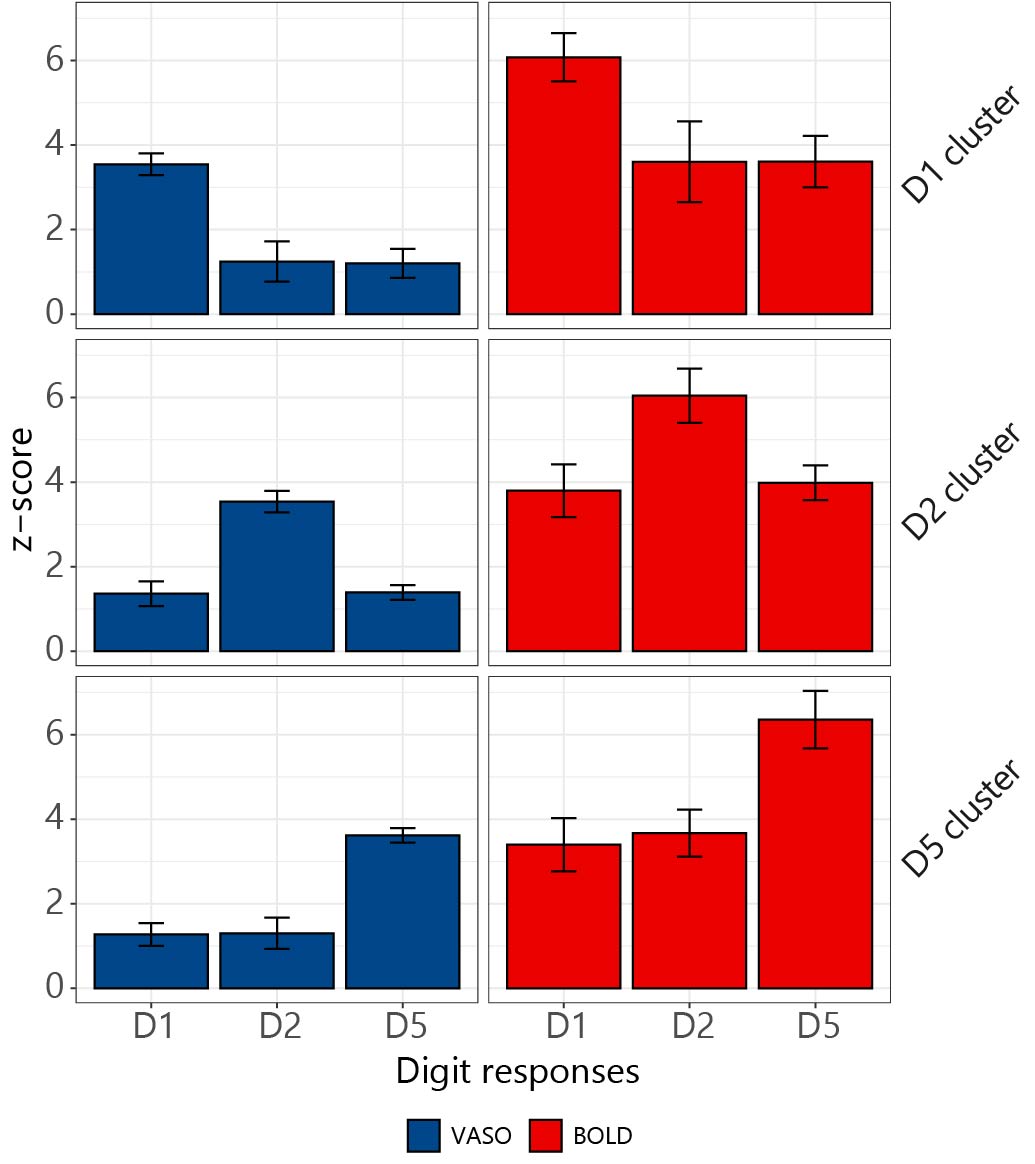
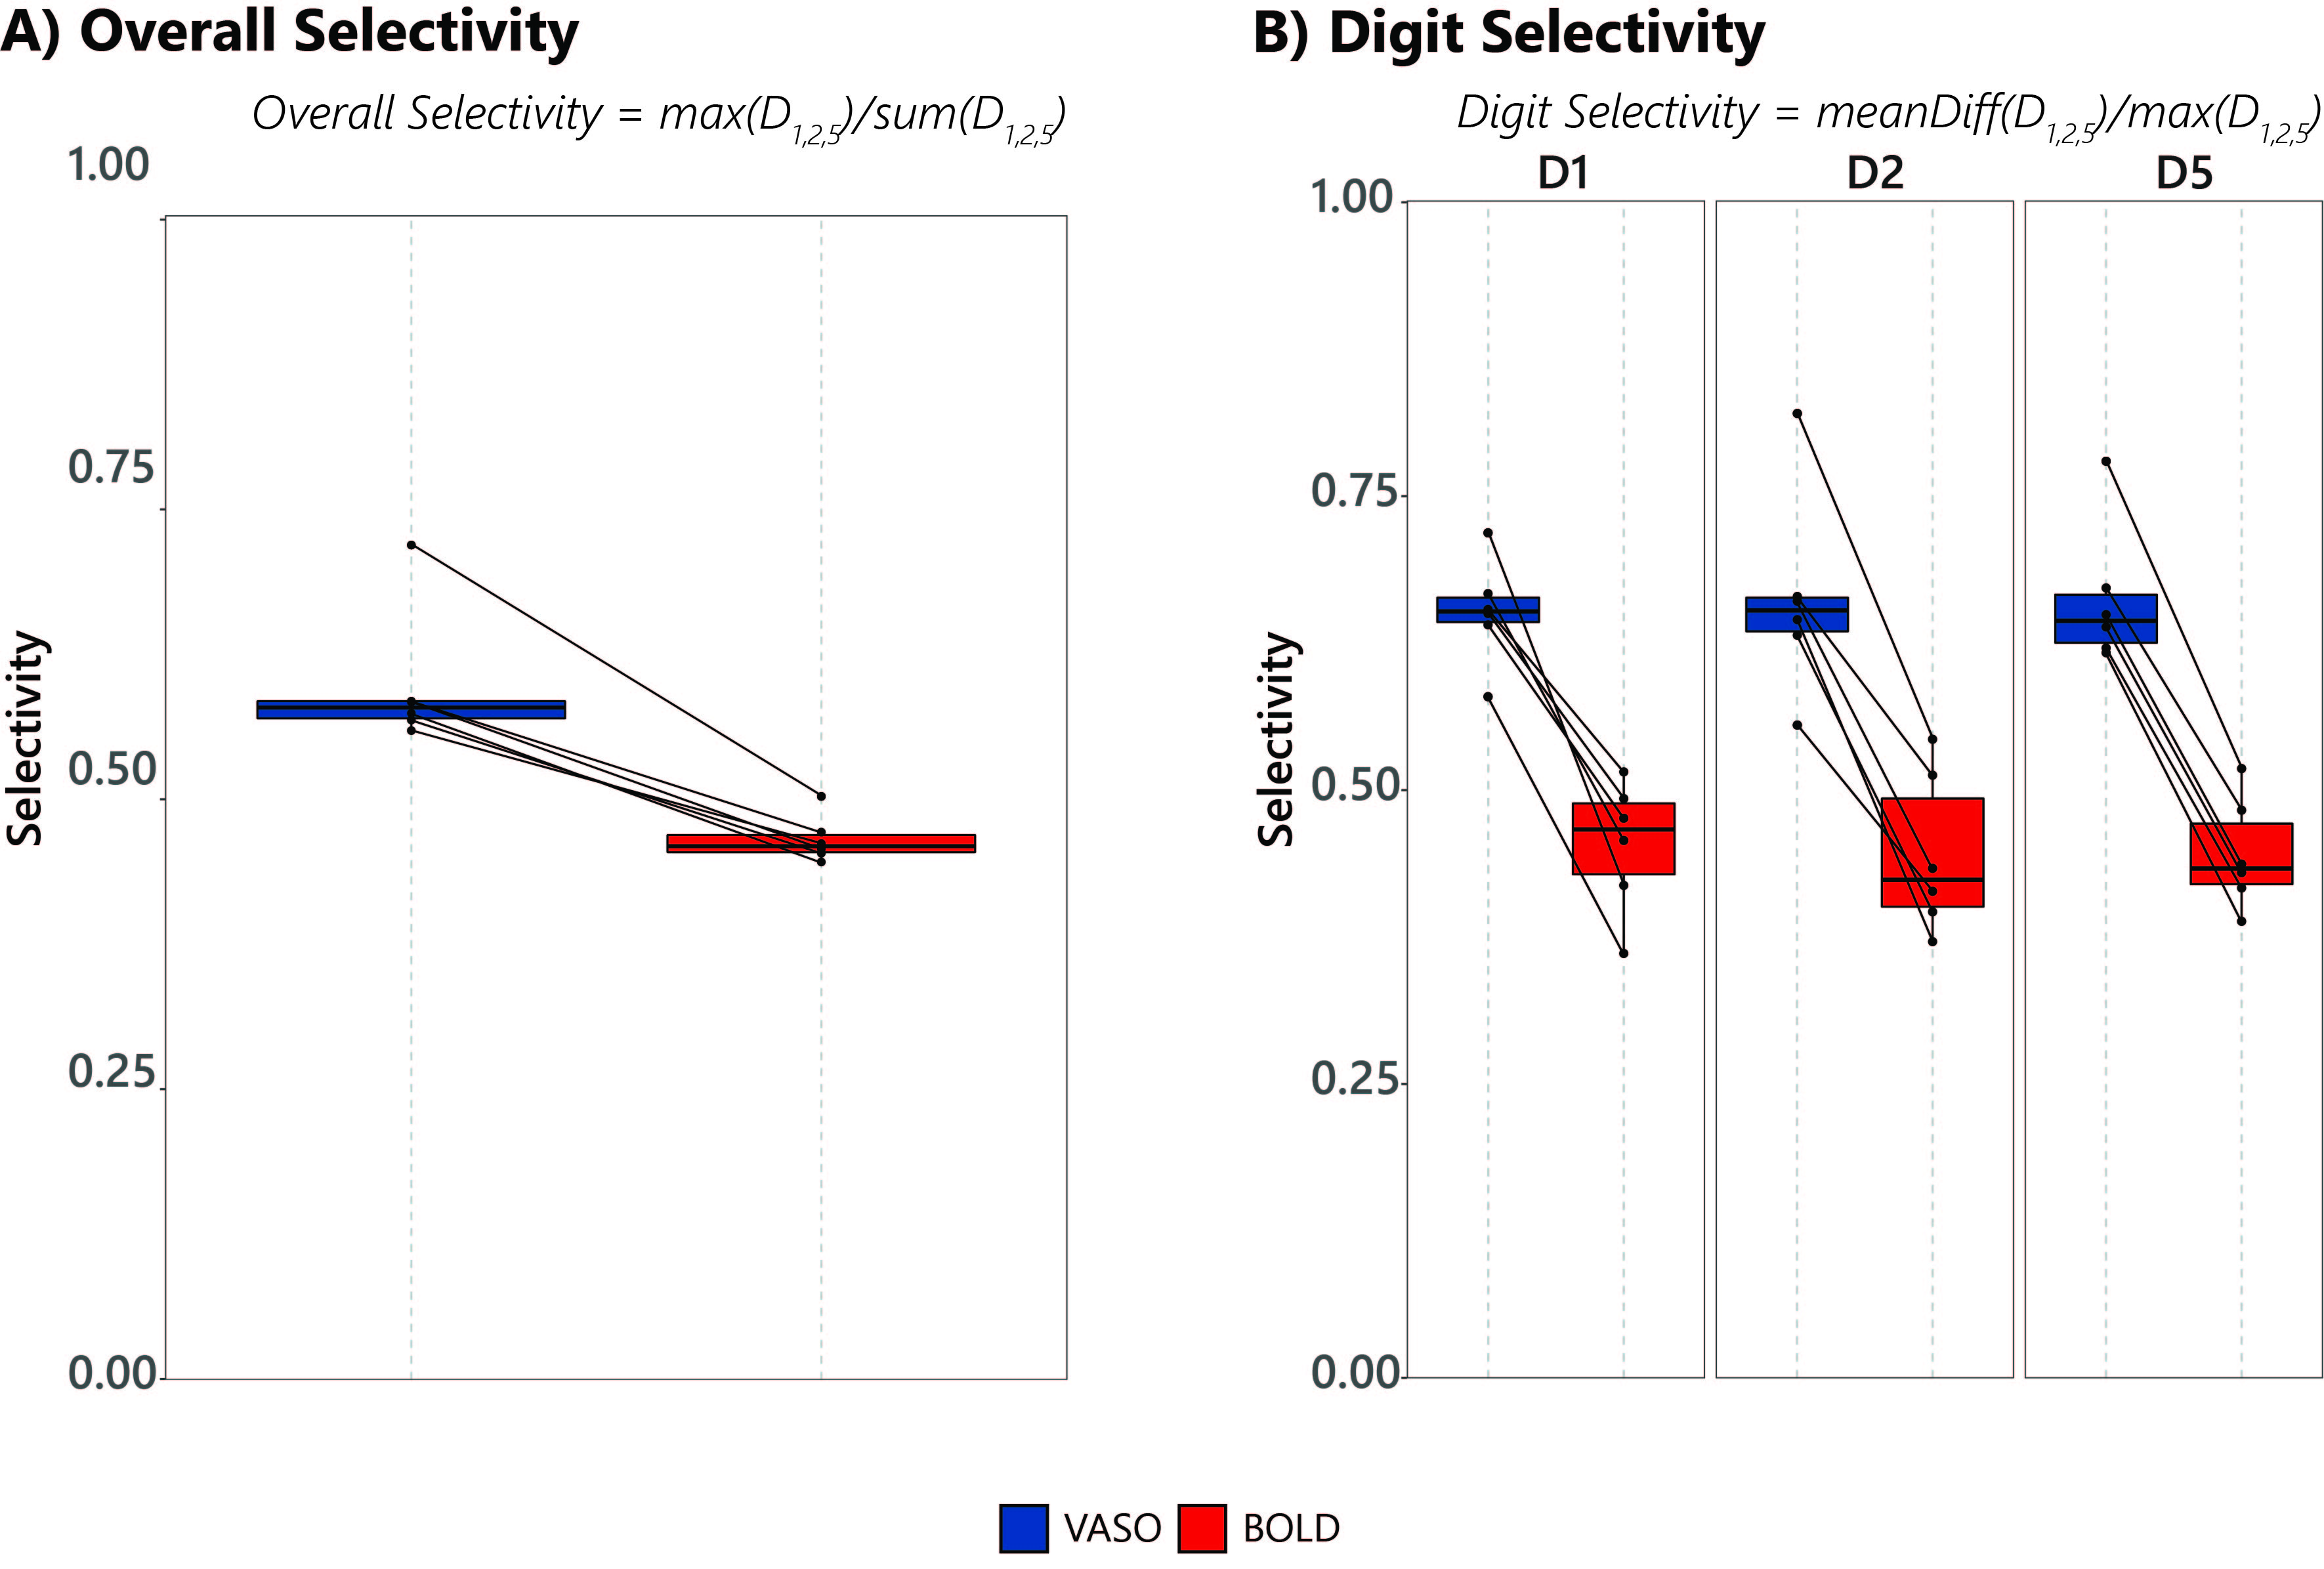
The map of the finger representation (Fig1) is in line with the previous findings1. We found distinct activation patterns for each of the three fingers using a block-designed task, organized in an orderly fashion (thumb-index-little) along the central sulcus, predominantly in S1 as described in previous fMRI studies1,2,11. Fig.2 shows the DICE and Jaccard similarity coefficients of each pair of digit clusters from both VASO-CBV and BOLD. Higher similarity scores represent a higher overlap between that pair of response patterns. For both measures, we observed higher overlap, and hence, lower spatial specificity for BOLD (Paired t-test, p<0.05) in all three-digit representation pairs. D1-D5 was somewhat lower than D1-D2 and D2-D5, confirming the presence of a somatotopic gradient for VASO-CBV data. Fig.3 shows the average z-scores of the dominant finger (digit cluster) relative to the average z-score of responses for movement of other digits in the same voxels for all six participants. Voxels were assigned with a winner-take-all strategy. The z-scores for movement of the non-dominant digit are higher in the BOLD data than in the VASO-CBV data, indicating that there is less overlap of VASO-CBV digit clusters than in BOLD maps, in agreement with the DICE/Jaccard similarity coefficients. Fig.4 shows the overall selectivity measure in A) and selectivity per digit in B). For both cases, VASO-CBV shows higher selectivity than BOLD (Paired t-test, p<0.05). We take both measures; the digit selectivity is better controlled (no division by 0 possible), while overall selectivity does not require the winner-take-all approach to assign a dominant digit. The outcomes of both measures are consistent with the earlier results.Conclusion
Here, we reliably visualized the finger representation map using a standard block-design task, with both VASO-CBV and BOLD. Using similarity measurements, we were able to quantify the spatial extent of overlap between each pair of digits, with BOLD yielding higher similarity (lower selectivity) than VASO-CBV. Additionally, we used two different metrics to assess selectivity. In both cases, VASO-CBV shows higher selectivity than BOLD. In summary, this confirms the higher spatial specificity of VASO-CBV compared to BOLD.Acknowledgements
No acknowledgement found.References
1. Siero, J. C. W. et al. BOLD matches neuronal activity at the mm scale: A combined 7T fMRI and ECoG study in human sensorimotor cortex. Neuroimage 101, 177–184 (2014).
2. Olman, C. A., Pickett, K. A., Schallmo, M. P. & Kimberley, T. J. Selective BOLD responses to individual finger movement measured with fMRI at 3T. Hum. Brain Mapp. 33, 1594–1606 (2012).
3. Schellekens, W., Petridou, N. & Ramsey, N. F. Detailed somatotopy in primary motor and somatosensory cortex revealed by Gaussian population receptive fields. Neuroimage 179, 337–347 (2018).
4. Martuzzi, R., van der Zwaag, W., Farthouat, J., Gruetter, R. & Blanke, O. Human finger somatotopy in areas 3b, 1, and 2: A 7T fMRI study using a natural stimulus. Hum. Brain Mapp. 35, 213–226 (2014).
5. Menon, R. S. Postacquisition suppression of large-vessel BOLD signals in high-resolution fMRI. Magn. Reson. Med. 47, 1–9 (2002).
6. Turner, R. How much codex can a vein drain? Downstream dilution of activation-related cerebral blood oxygenation changes. Neuroimage 16, 1062–1067 (2002).
7. Huber, L. et al. Slab-selective, BOLD-corrected VASO at 7 tesla provides measures of cerebral blood volume reactivity with high signal-to-noise ratio. Magn. Reson. Med. 72, 137–148 (2014).
8. Oliveira, Í. A. F., van der Zwaag, W., Raimondo, L., Dumoulin, S. O. & Siero, J. C. W. Comparing hand movement rate dependence of cerebral blood volume and BOLD responses at 7T. Neuroimage 226, 117623 (2021).
9. Moeller, S. et al. NOise reduction with DIstribution Corrected (NORDIC) PCA in dMRI with complex-valued parameter-free locally low-rank processing. Neuroimage 226, (2021).
10. Vizioli, L. et al. Lowering the thermal noise barrier in functional brain mapping with magnetic resonance imaging. Nat. Commun. 12, 5181 (2021).
11. Huber, L. et al. Sub-millimeter fMRI reveals multiple topographical digit representations that form action maps in human motor cortex. Neuroimage 208, (2020).
Figures