2190
Laminar fMRI with MT-prepared multi-echo 3D FLASH1Erwin L. Hahn Institute for Magnetic Resonance Imaging, University of Duisburg-Essen, Essen, Germany, 2High Field and Hybrid MR Imaging, University Hospital Essen, University of Duisburg-Essen, Essen, Germany
Synopsis
The GRE-BOLD contrast used in laminar fMRI suffers from suboptimal specificity due to extravascular effects around large veins. CBV-weighting offers improved specificity with signal changes being more confined to microvasculature. CBV-weighting can be achieved through saturation of gray matter signal with magnetization transfer. We use a multi-echo FLASH sequence at 7 Tesla, with and without MT preparation to investigate its feasibility at ultrahigh field. We analyze the TE dependence to determine when the BOLD T2’-effects start to dominate the MT-weighted signal changes. The MTprep profiles exhibit a stronger signal change in gray matter at short TEs and reduced extravascular effects.
Introduction
Recent experiments with a conventional MT-prepared EPI-BOLD sequence1 have shown increased signal changes at short TE, indicative of CBV-weighting of the signal. CBV-weighted fMRI is interesting for its improved specificity compared to GRE-BOLD. Through exploitation of the magnetization transfer mechanism, this CBV-weighting could be achieved with only a minor increase in scan time making it an attractive alternative to common CBV techniques like VASO2,3. In this work, we present our findings of an MT-prepared multi-echo FLASH sequence used for laminar fMRI. Based on these we confirm that with the application of MT, laminar fMRI profiles exhibit reduced contribution from unwanted extravascular (EV) effects, and an increased sensitivity to intravascular (IV) signal changes which are more confined to gray matter (GM). This signal change is additive to the BOLD effect and is strongest at short TE.Methods
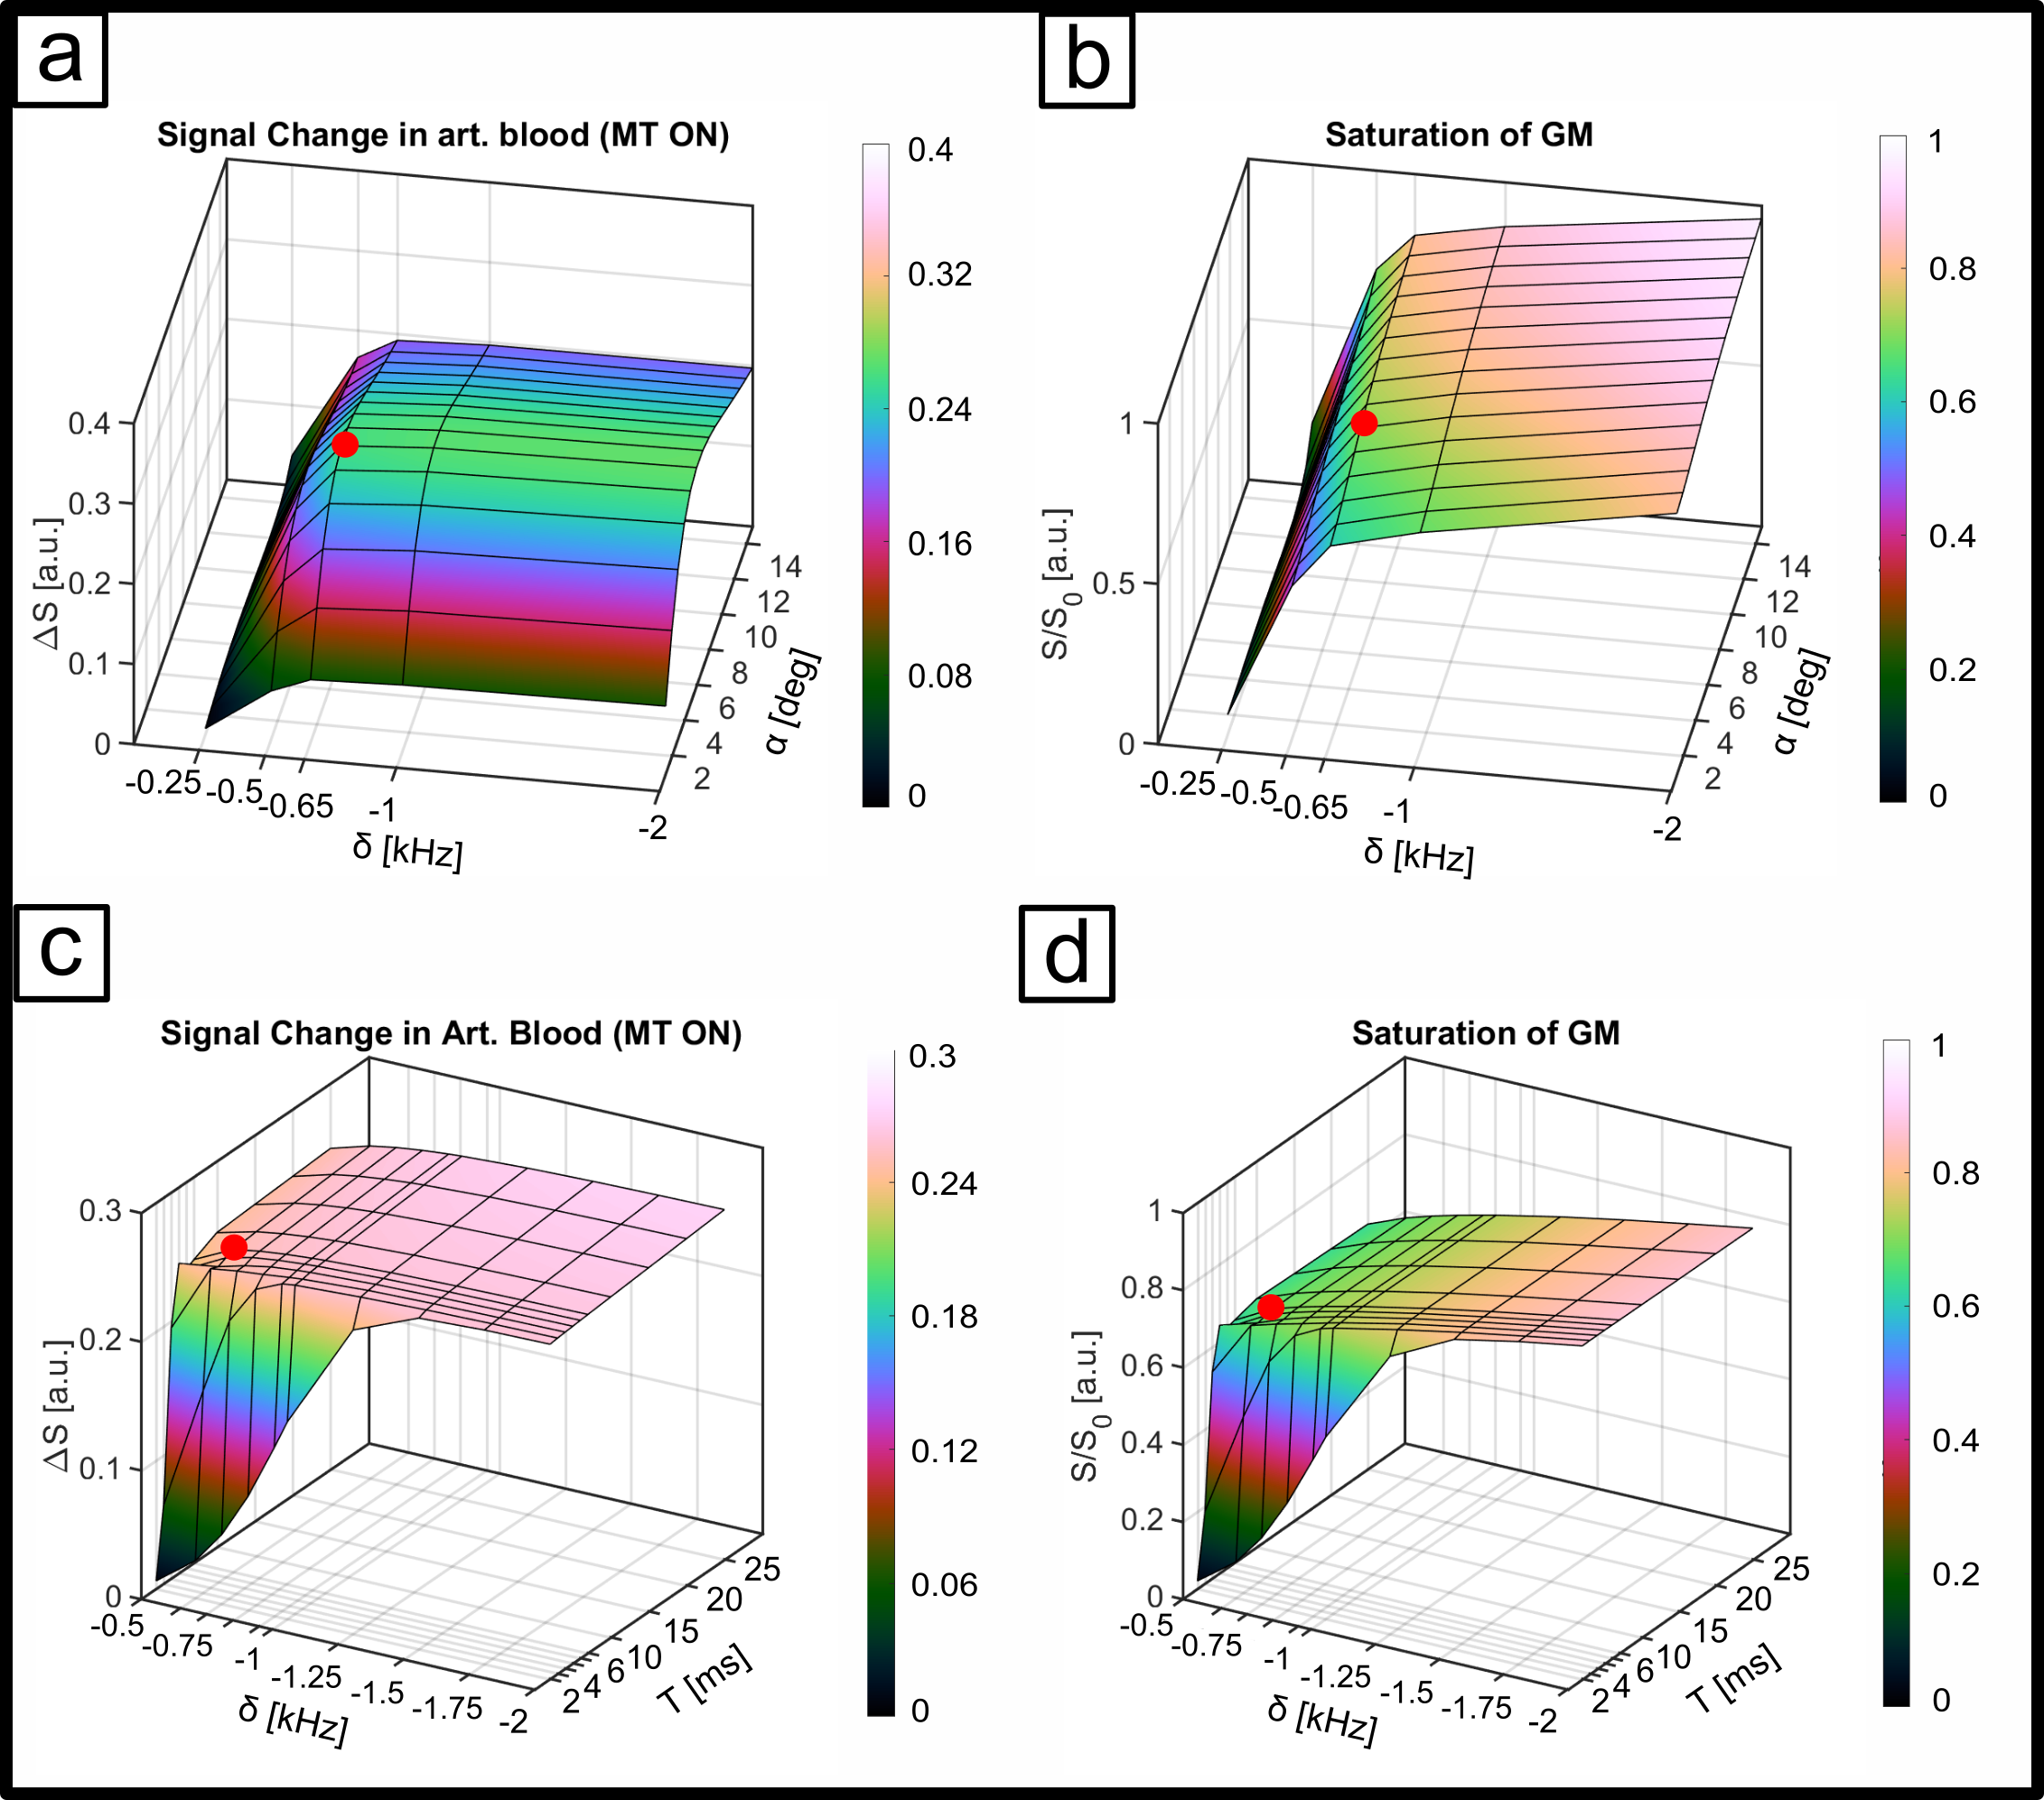
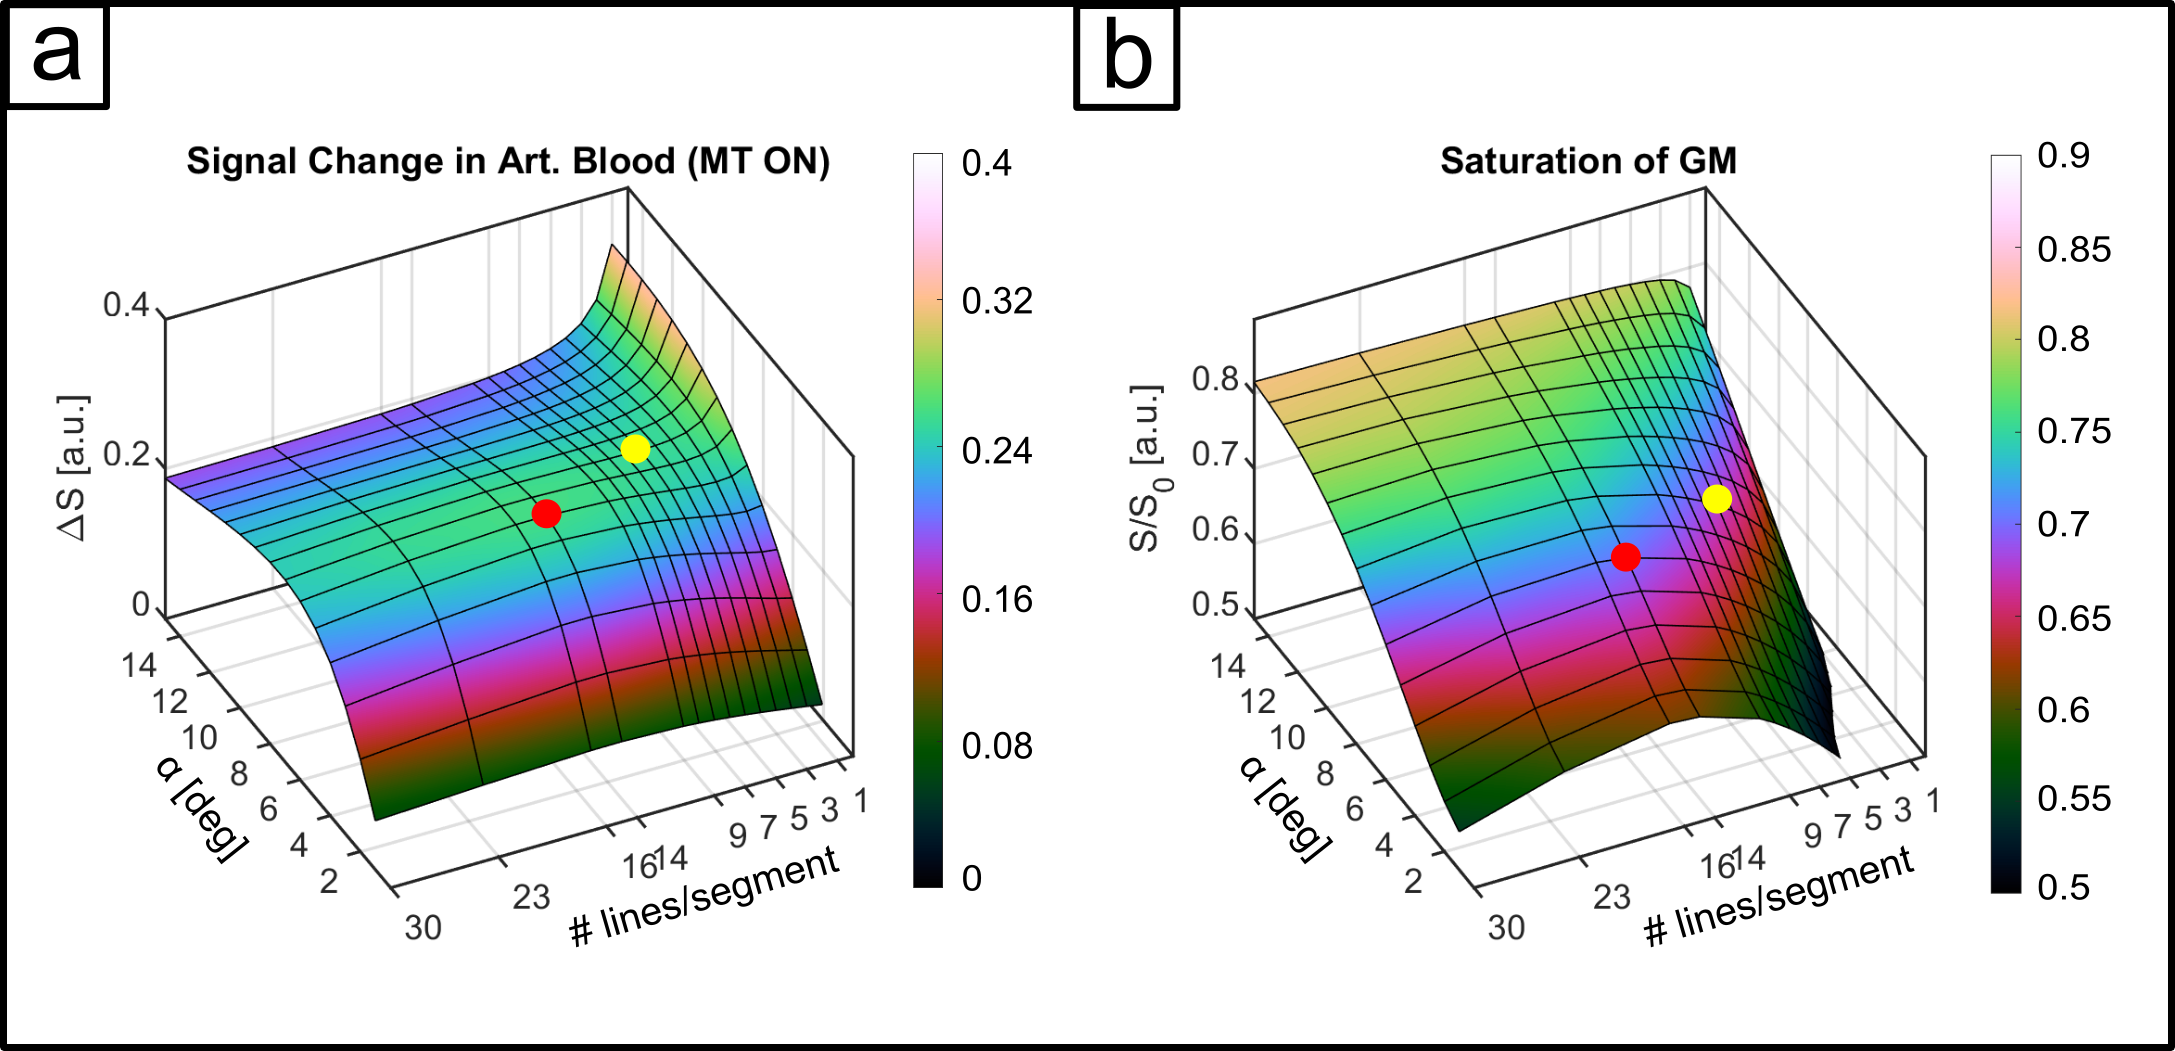
The sequence consists of an off-resonant MT-module followed by a multi-echo 3D FLASH readout. The Gaussian MT-pulse had a nominal flip angle (FA) of 225° and was optimized numerically4 using realistic tissue parameters5,6 to achieve, within SAR limits, high GM signal attenuation and minimal direct saturation of arterial blood, subject to an MT-module duty cycle limit of less than 10%. Optimization parameters were off-resonance frequency, pulse duration, readout FA and segmentation factor. Experiments were performed on 8 subjects (25 ± 4.4 years) at a Siemens Terra 7T scanner equipped with an 8Tx/32Rx head coil. To increase transmit B1 in the visual cortex we acquired the functional data in CP2+-mode. Sequence parameters were: 252x252x32 matrix, monopolar multi-echo readout, TEs: 1.86, 4.28, 6.7 and 9.12ms, TR 11.6ms, FA 6°. (see Fig. 1a,b). The primary PE dimension was sampled center-out with 3-fold undersampling and 7-fold segmentation to reduce unwanted T1-relaxation effects during readout. The segment TR was 179ms (see Fig. 2), volume TR was 40.1s. We performed a flickering checkerboard fMRI experiment split into 4 runs, 2 with and 2 without MT-preparation, keeping readout TR between the two conditions identical. Structural data were acquired with an MP2RAGE sequence and processes with FreeSurfer. Functional data were processed using SPM12 and ITK-SNAP. The data were equidistantly sampled between the WM and pial boundaries to create laminar profiles for each echo. For each volume, the profiles were extrapolated toward TE=0ms using nonlinear fitting before GLM analysis.Results
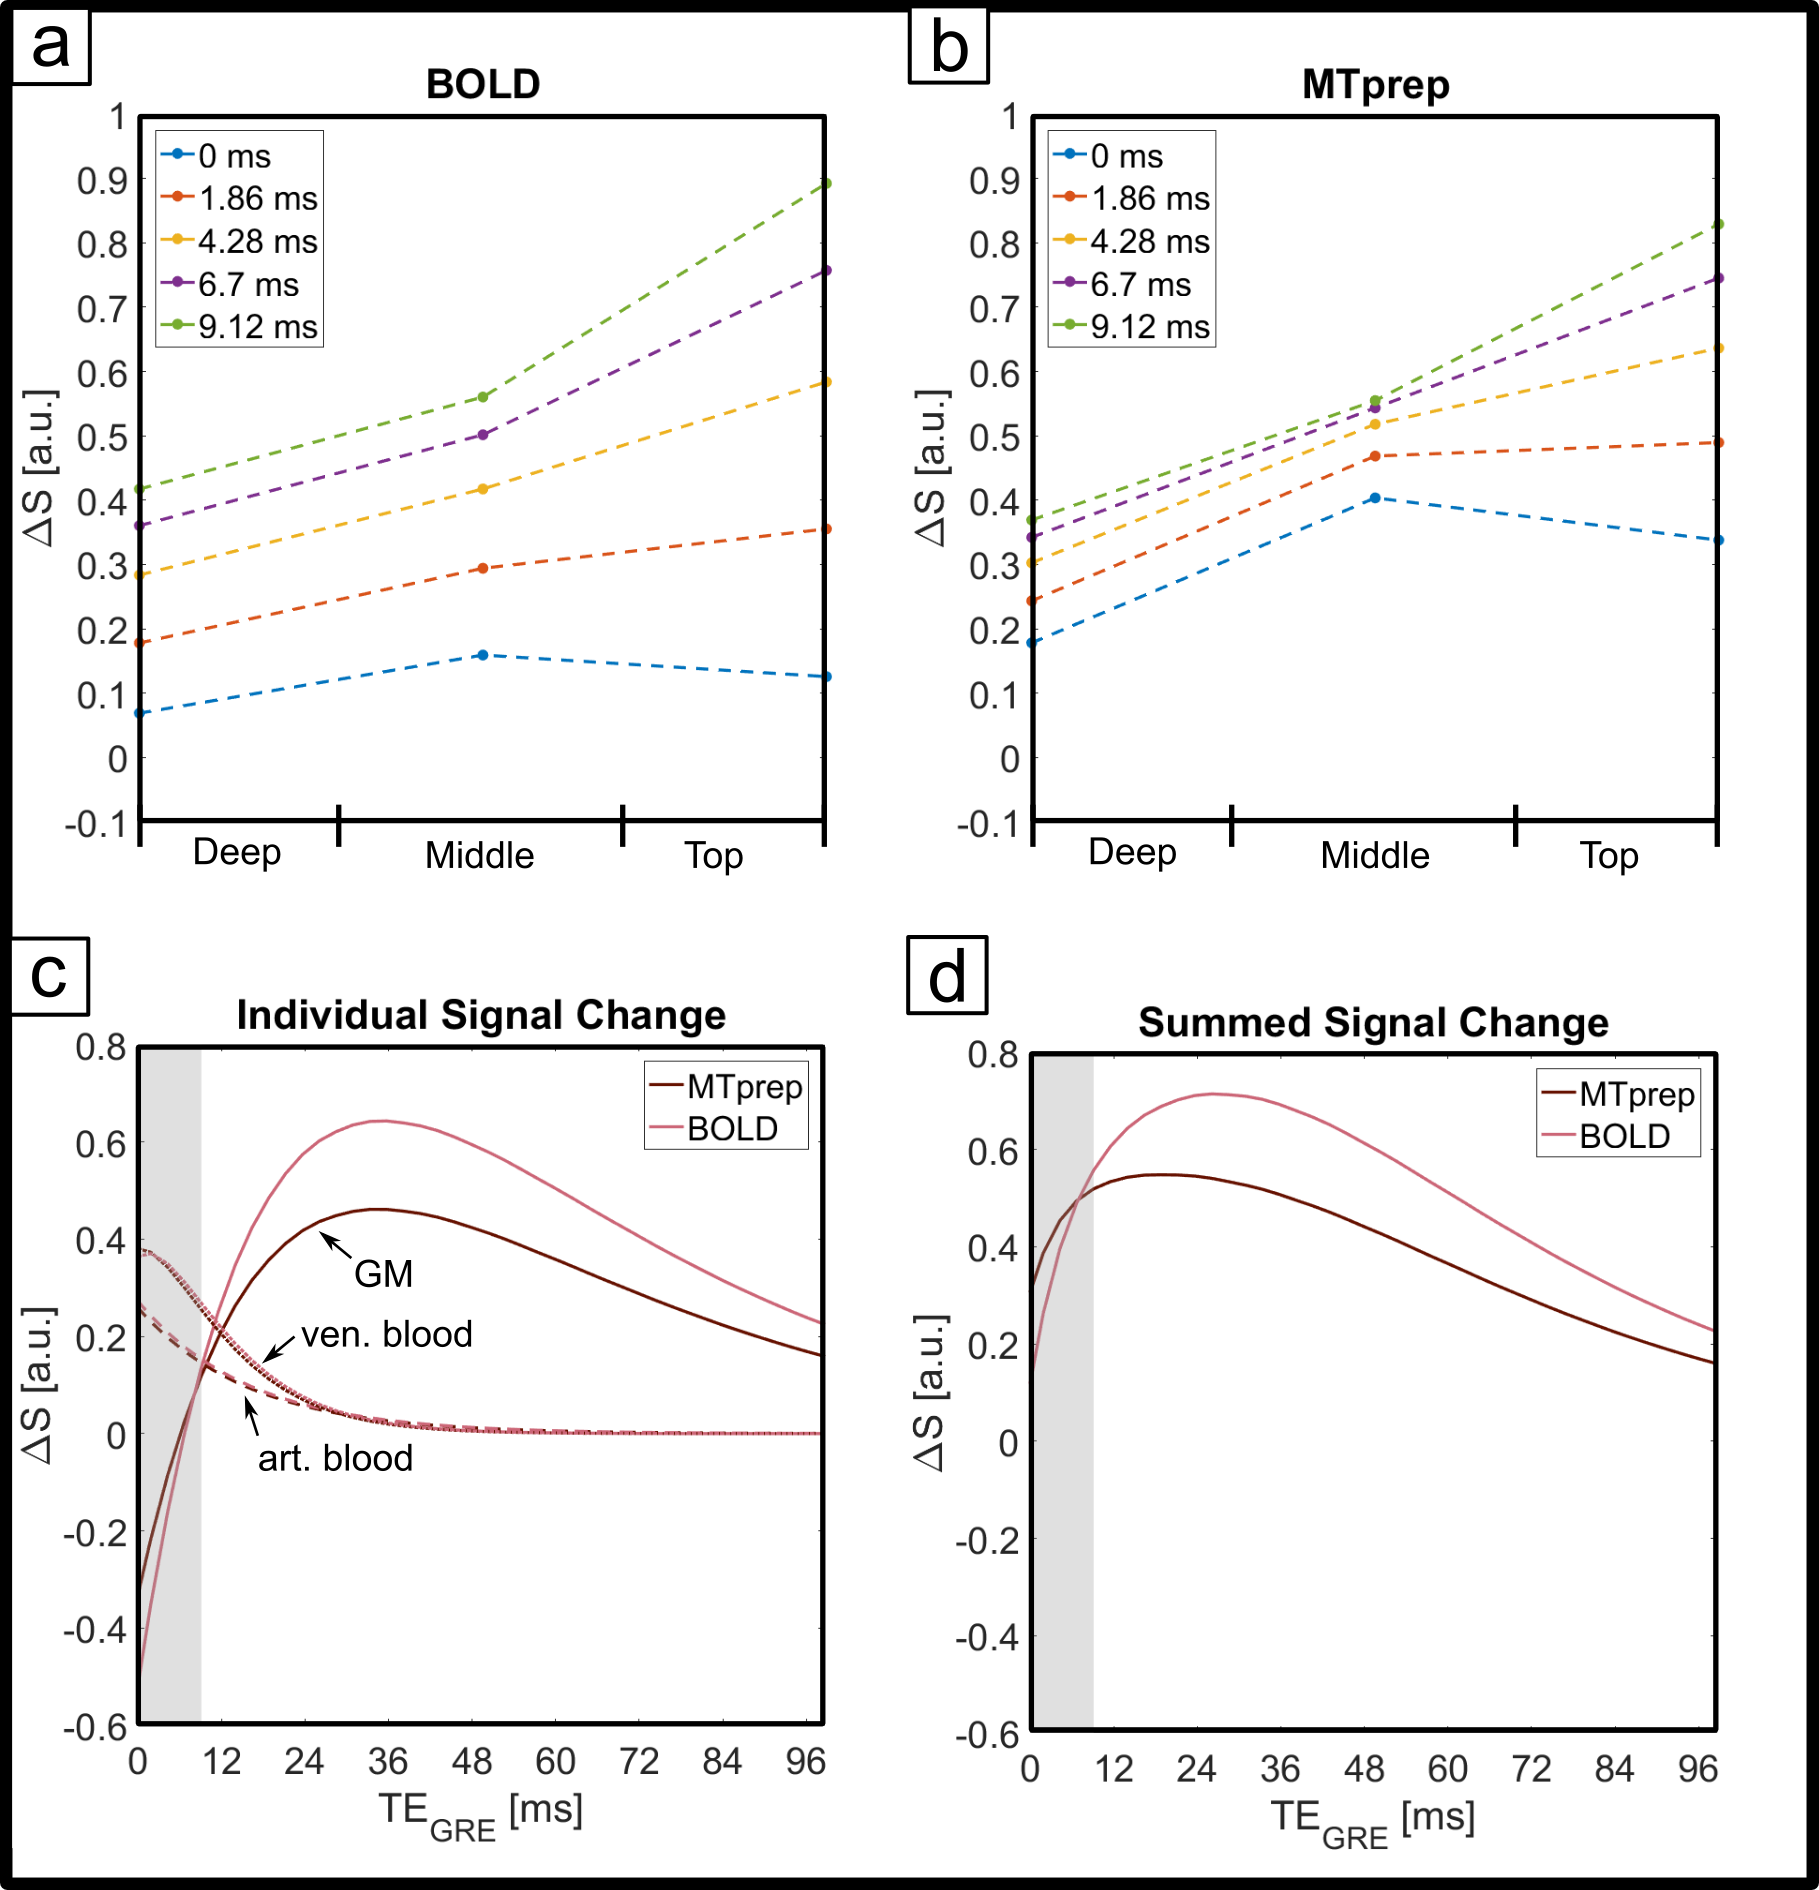
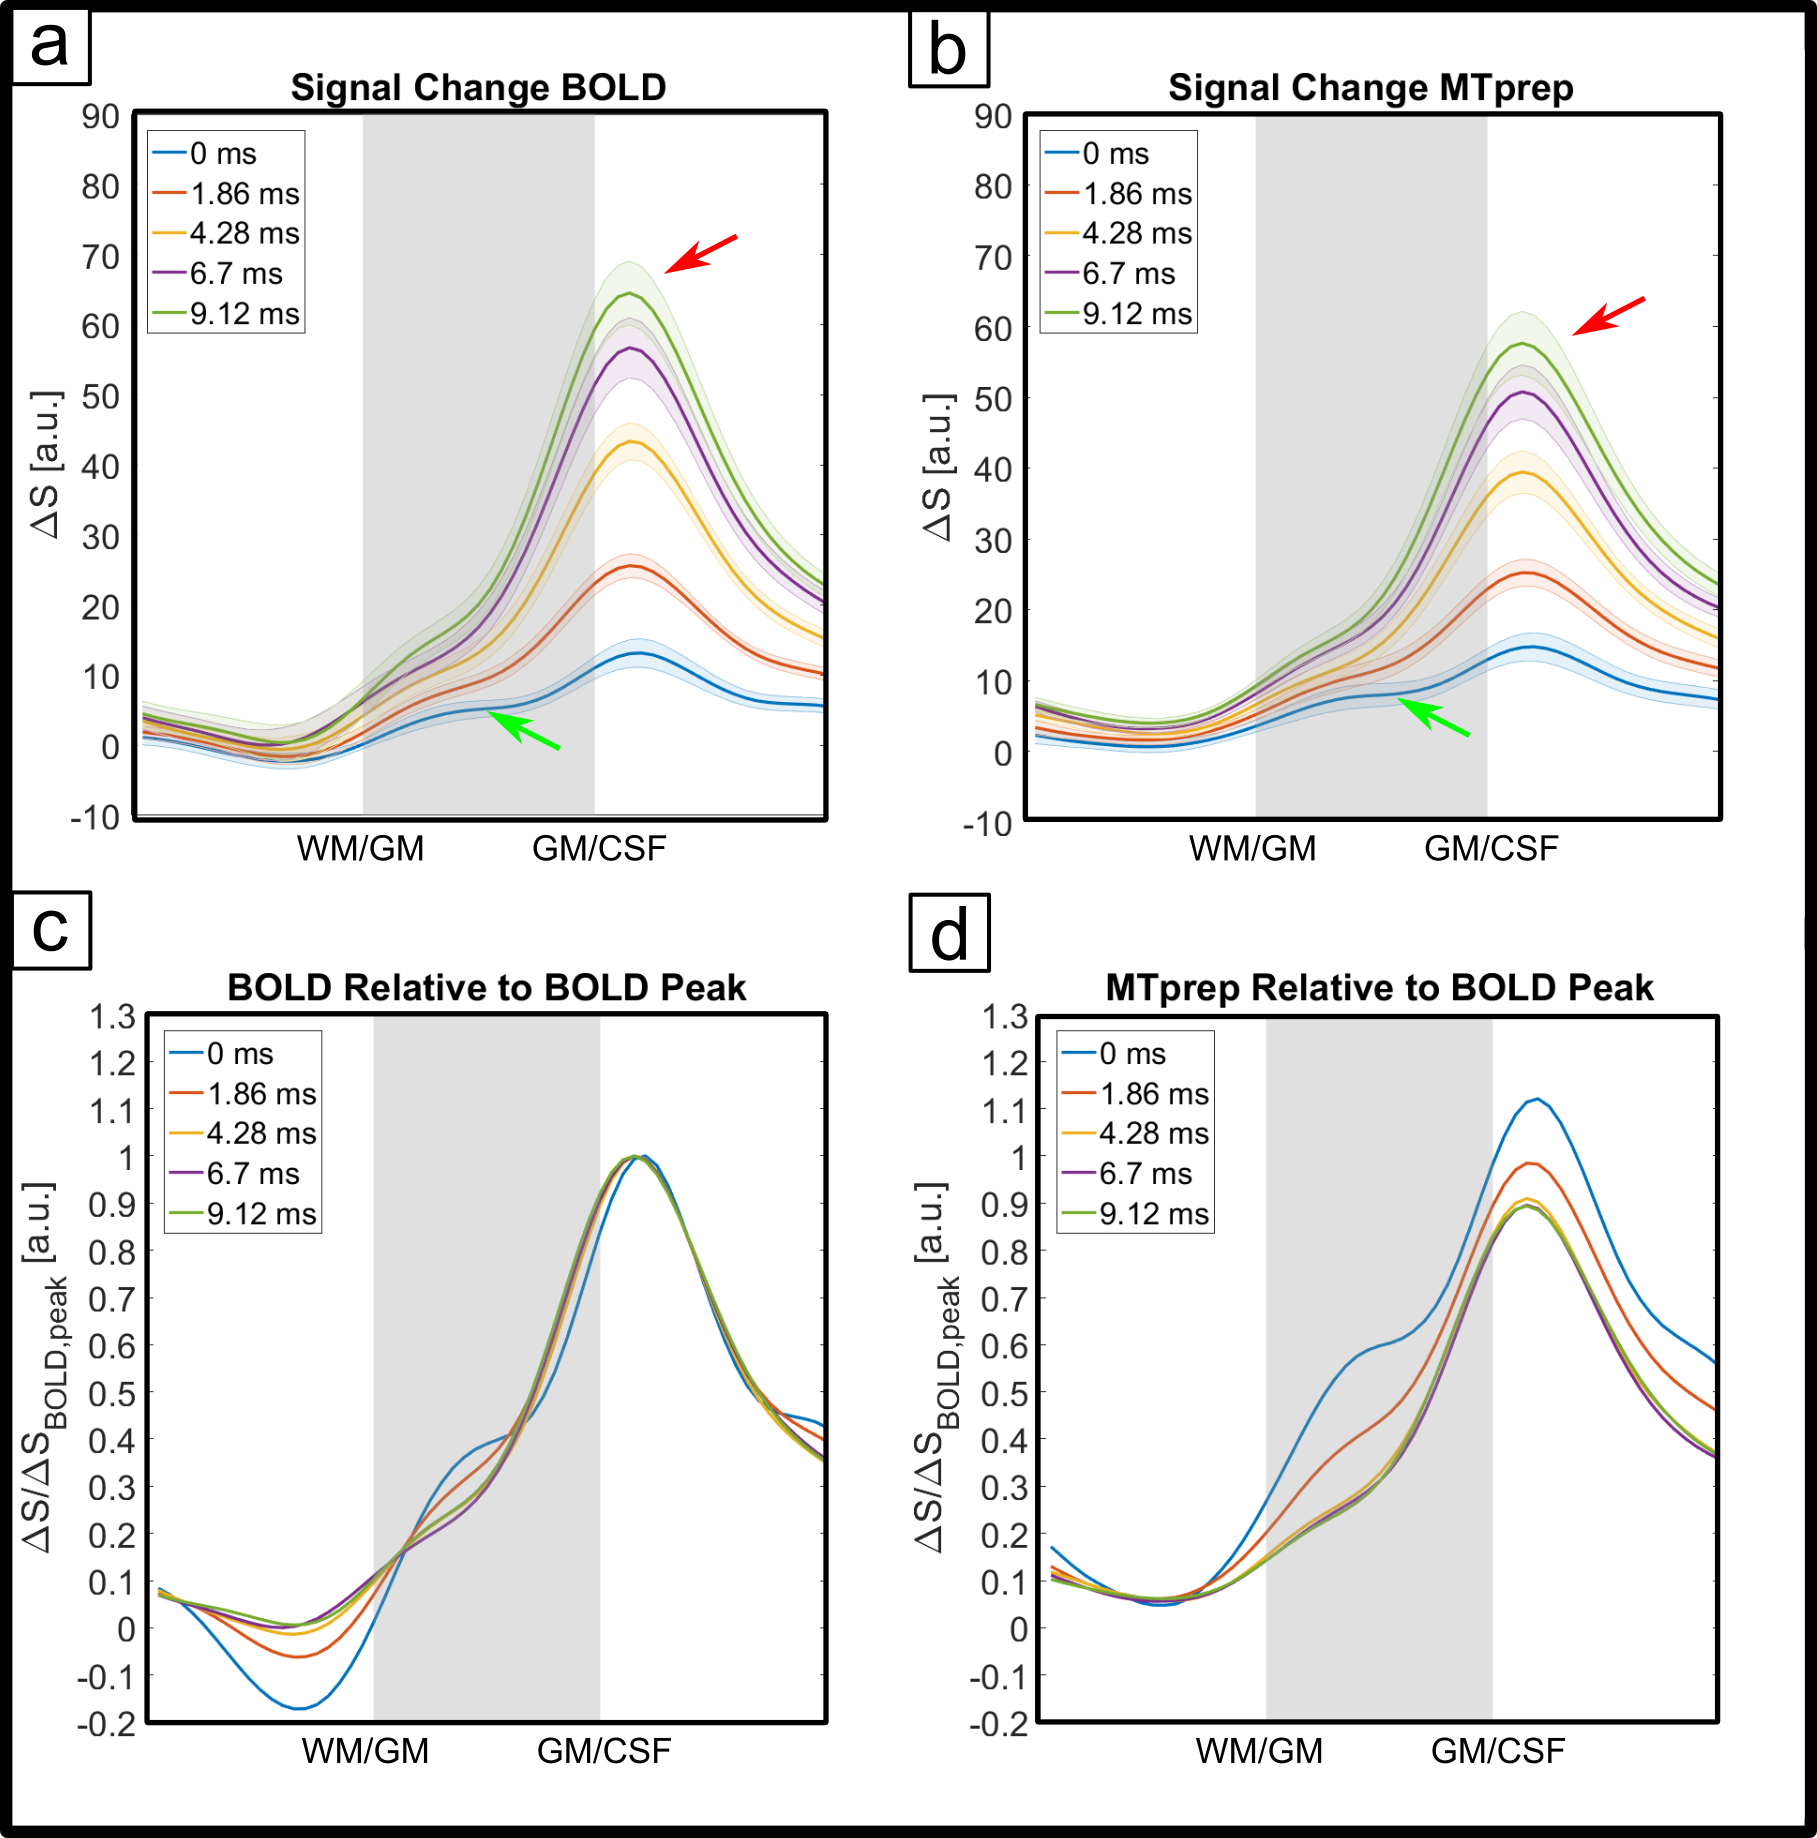
The numerical optimization shown in Fig. 1 resulted in the choice of a 4 ms MT-pulse (697 Hz bandwidth) played out at -650 Hz off-resonance frequency.The simulated laminar signal change (ΔS) profiles with MTprep (Fig. 3b) show a weaker TE-dependency than the BOLD reference (Fig. 3a) and a stronger ΔS, primarily in the middle layer for TE=0ms (blue curves in 3a,b). Simulations of individual compartments (3c) show that the weaker TE-dependency stems from reduced EV field effects (there is less GM signal to express this EV effect), while the increased ΔS at 0ms is the result of the MT-induced CBV contrast. The ΔS summed over all compartments (3d) indicates a sensitivity shift toward shorter echoes with MTprep and a stronger ΔS compared to BOLD up to a TE of approx. 8ms. Fig. 4 shows the subject-averaged measured profiles (mean ± SE) . With MT (4b), they exhibit a decreased TE-dependent signal change compared to BOLD (4a) confirming the expectations of our simulations regarding reduced EV effects with MT. The extrapolated 0ms profile and the 1st measured echo show a slightly stronger ΔS inside GM which can be seen more clearly when normalizing each echo relative to the peak of the BOLD measurement (Fig. 4c,d). This can be attributed to increased sensitivity towards changes in CBV with MT.
Discussion
Our results show that MT-weighting reduces the contribution of extravascular ΔS in GM (lines in Fig 4 are closer together). Also, at very short TE, the method is more sensitive to activity than BOLD and our simulations (Fig 3c) suggest that this is primarily due to a reduced negative signal change contribution of GM (when CBV increases there is less GM in the voxel). However, due to the limited GM saturation of 30% that can be achieved within SAR limits through MT effects of macromolecules without saturating longer T2-species like blood and GM directly, the effects are relatively small. Alternatives could include using on-resonance MT pulses that result in MT contrast as well as direct suppression, leading to a composite CBV-T2-weighted method. Executing off-resonance MT at a more SAR-favorable field strength like 3T is also attractive as a larger GM suppression factor could be achieved. Nonetheless, the off-resonance 7T method can be used as a straightforward tool with minimal scan-time costs to reduce unwanted GM dephasing by large veins in GRE-BOLD and/or allow scanning at much shorter TEs without incurring a sensitivity penalty. Please note that through the use of shorter TEs there is an additional reduction in extravascular dephasing sensitivity, separate from the reduced GM signal due to MT-suppression itself. In summary, MT-prepared fMRI is a straightforward method to reduce sensitivity to unwanted extravascular effects. Based on our findings, we expect an MT module prefixed to a short-TE center-out EPI scheme (e.g. spirals) to be very promising for high-resolution fMRI.Acknowledgements
This work was funded by DFG grant KO5341/1-1 and DFG grant 432657511.References
1. Schulz J. et al. (2020): Arterial blood contrast (ABC) enabled by magnetization transfer (MT): a novel MRI technique for enhancing the measurement of brain activation changes. Biorxiv. doi: 10.1101/2020.05.20.106666.
2. Lu H. et al. (2003): Functional magnetic resonance imaging based on changes in vascular space occupancy. MRM. doi: 10.1002/mrm.10519.
3. Huber L. et al. (2017): High-Resolution CBV-fMRI Allows Mapping of Laminar Activity and Connectivity of Cortical Input and Output in Human M1. Neuron. doi: 10.1016/j.neuron.2017.11.005.
4. Karakuzu A. et al. (2020): qMRLab: Quantitative MRI analysis, under one umbrella. J. Open Source Softw. doi: 10.21105/joss.02343.
5. Markuerkiaga I. et al. (2016): A cortical vascular model for examining the specificity of the laminar BOLD signal. NeuroImage. doi: 10.1016/j.neuroimage.2016.02.073.
6. Akbari A. et al. (2021): Modelling the depth-dependent VASO and BOLD responses in human primary visual cortex. Biorxiv. doi: 10.1101/2021.05.07.443052.
Figures