2193
Laminar and columnar functional organization of human area MT using VASO at 7T1Department of Cognitive Neuroscience, Faculty of Psychology and Neuroscience, Maastricht University, Maastricht, Netherlands, 2Brain Innovation, Maastricht, Netherlands, 3National Institutes of Mental Health, MEG Core Facility, Bethesda, MD, United States
Synopsis
We investigate the feasibility of using CBV-sensitive VASO fMRI at ultra-high field to study the selective columnar organization to axes of motion stimuli in human area MT.
For 5 subjects we found:
- BOLD and VASO both reveal characteristic tuning curves for axes of motion.
- VASO is more specific and less sensitive than BOLD.
- VASO layer profiles are less distorted by superficial veins than BOLD.
- Columnar analysis is feasible using VASO.
Purpose
Ultra-high field (>=7T) functional magnetic resonance imaging (fMRI) provides a unique opportunity to investigate the columnar and laminar organization of the human brain in vivo. The middle temporal area in humans (hMT) shows a selective columnar response to directions or axes of motion as revealed by conventional BOLD fMRI contrast with rapid gradient-echo (GE) imaging1,2. Although GE-BOLD has been widely applied in fMRI studies, its spatial specificity is reduced by oxygenation changes in draining veins3. Alternatives like SS-SI-VASO sensitive to cerebral blood volume (CBV) offer higher spatial specificity to the microvasculature and improved quantifiability at the cost of reduced signal sensitivity and increased acquisition time with respect to GE-BOLD4,5. Here, we investigated, for the first time, the feasibility of mapping axes of motion in hMT and its laminar-columnar functional organization using VASO compared to conventional BOLD.Methods
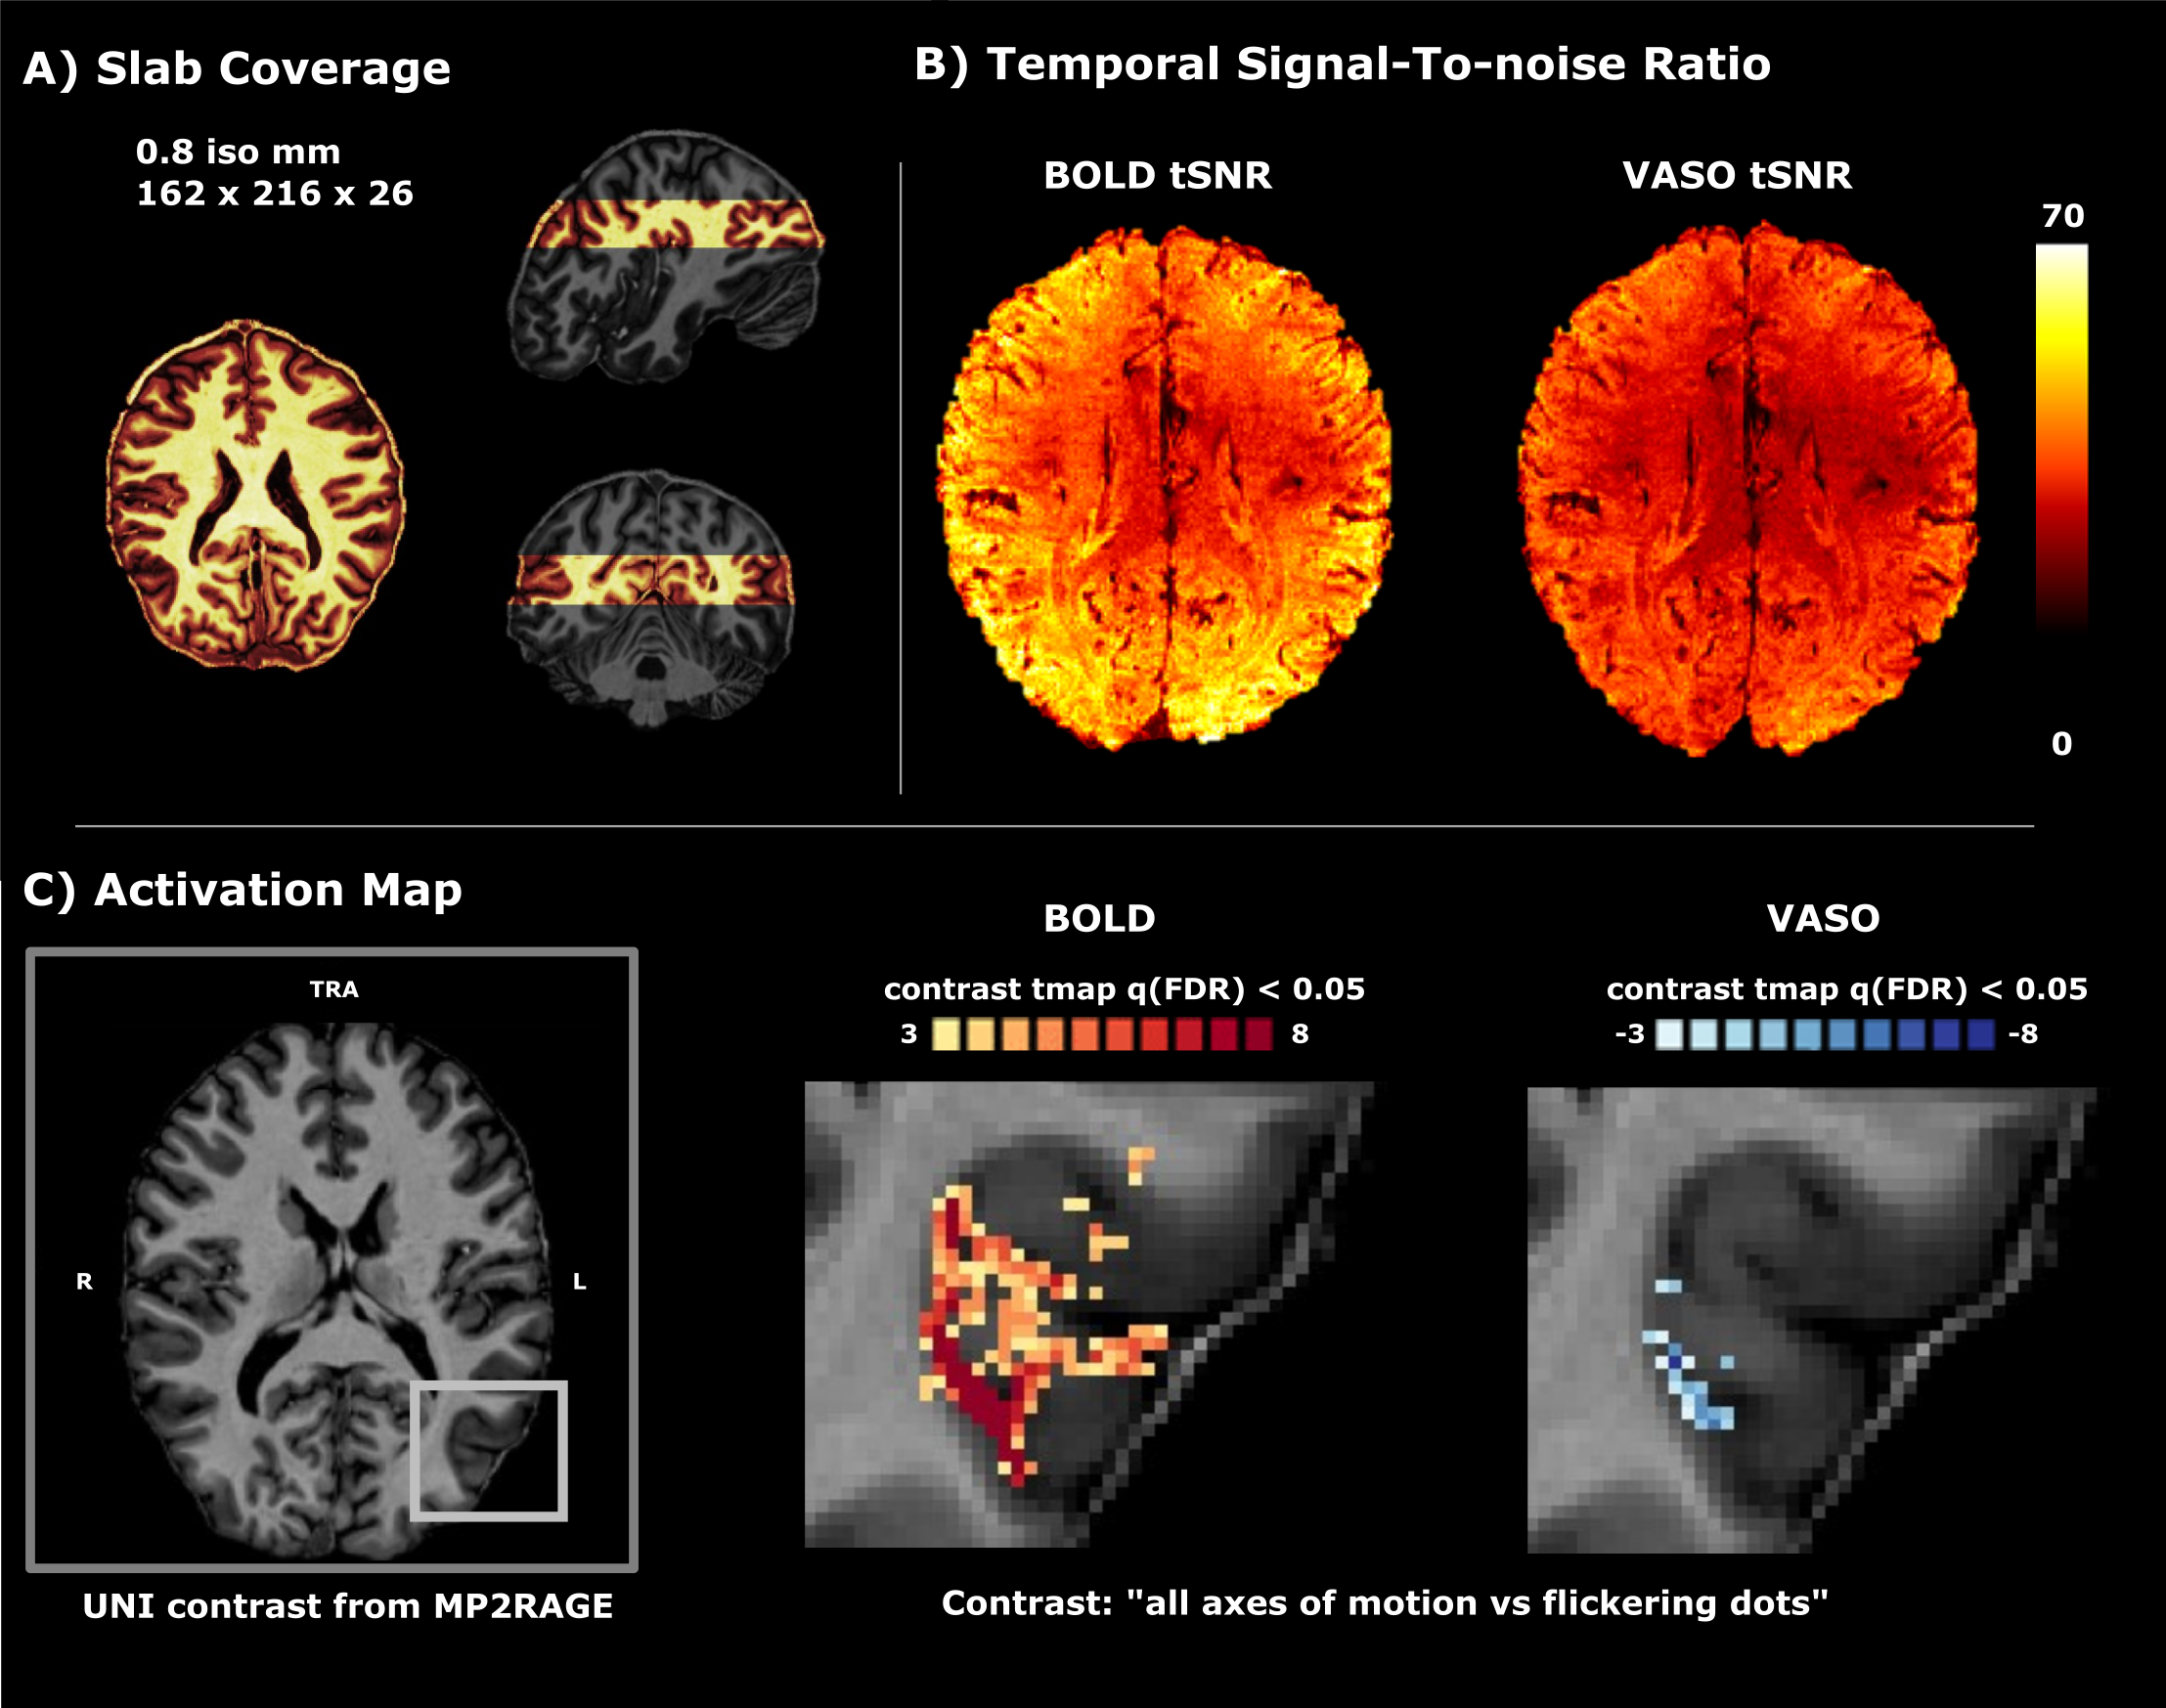
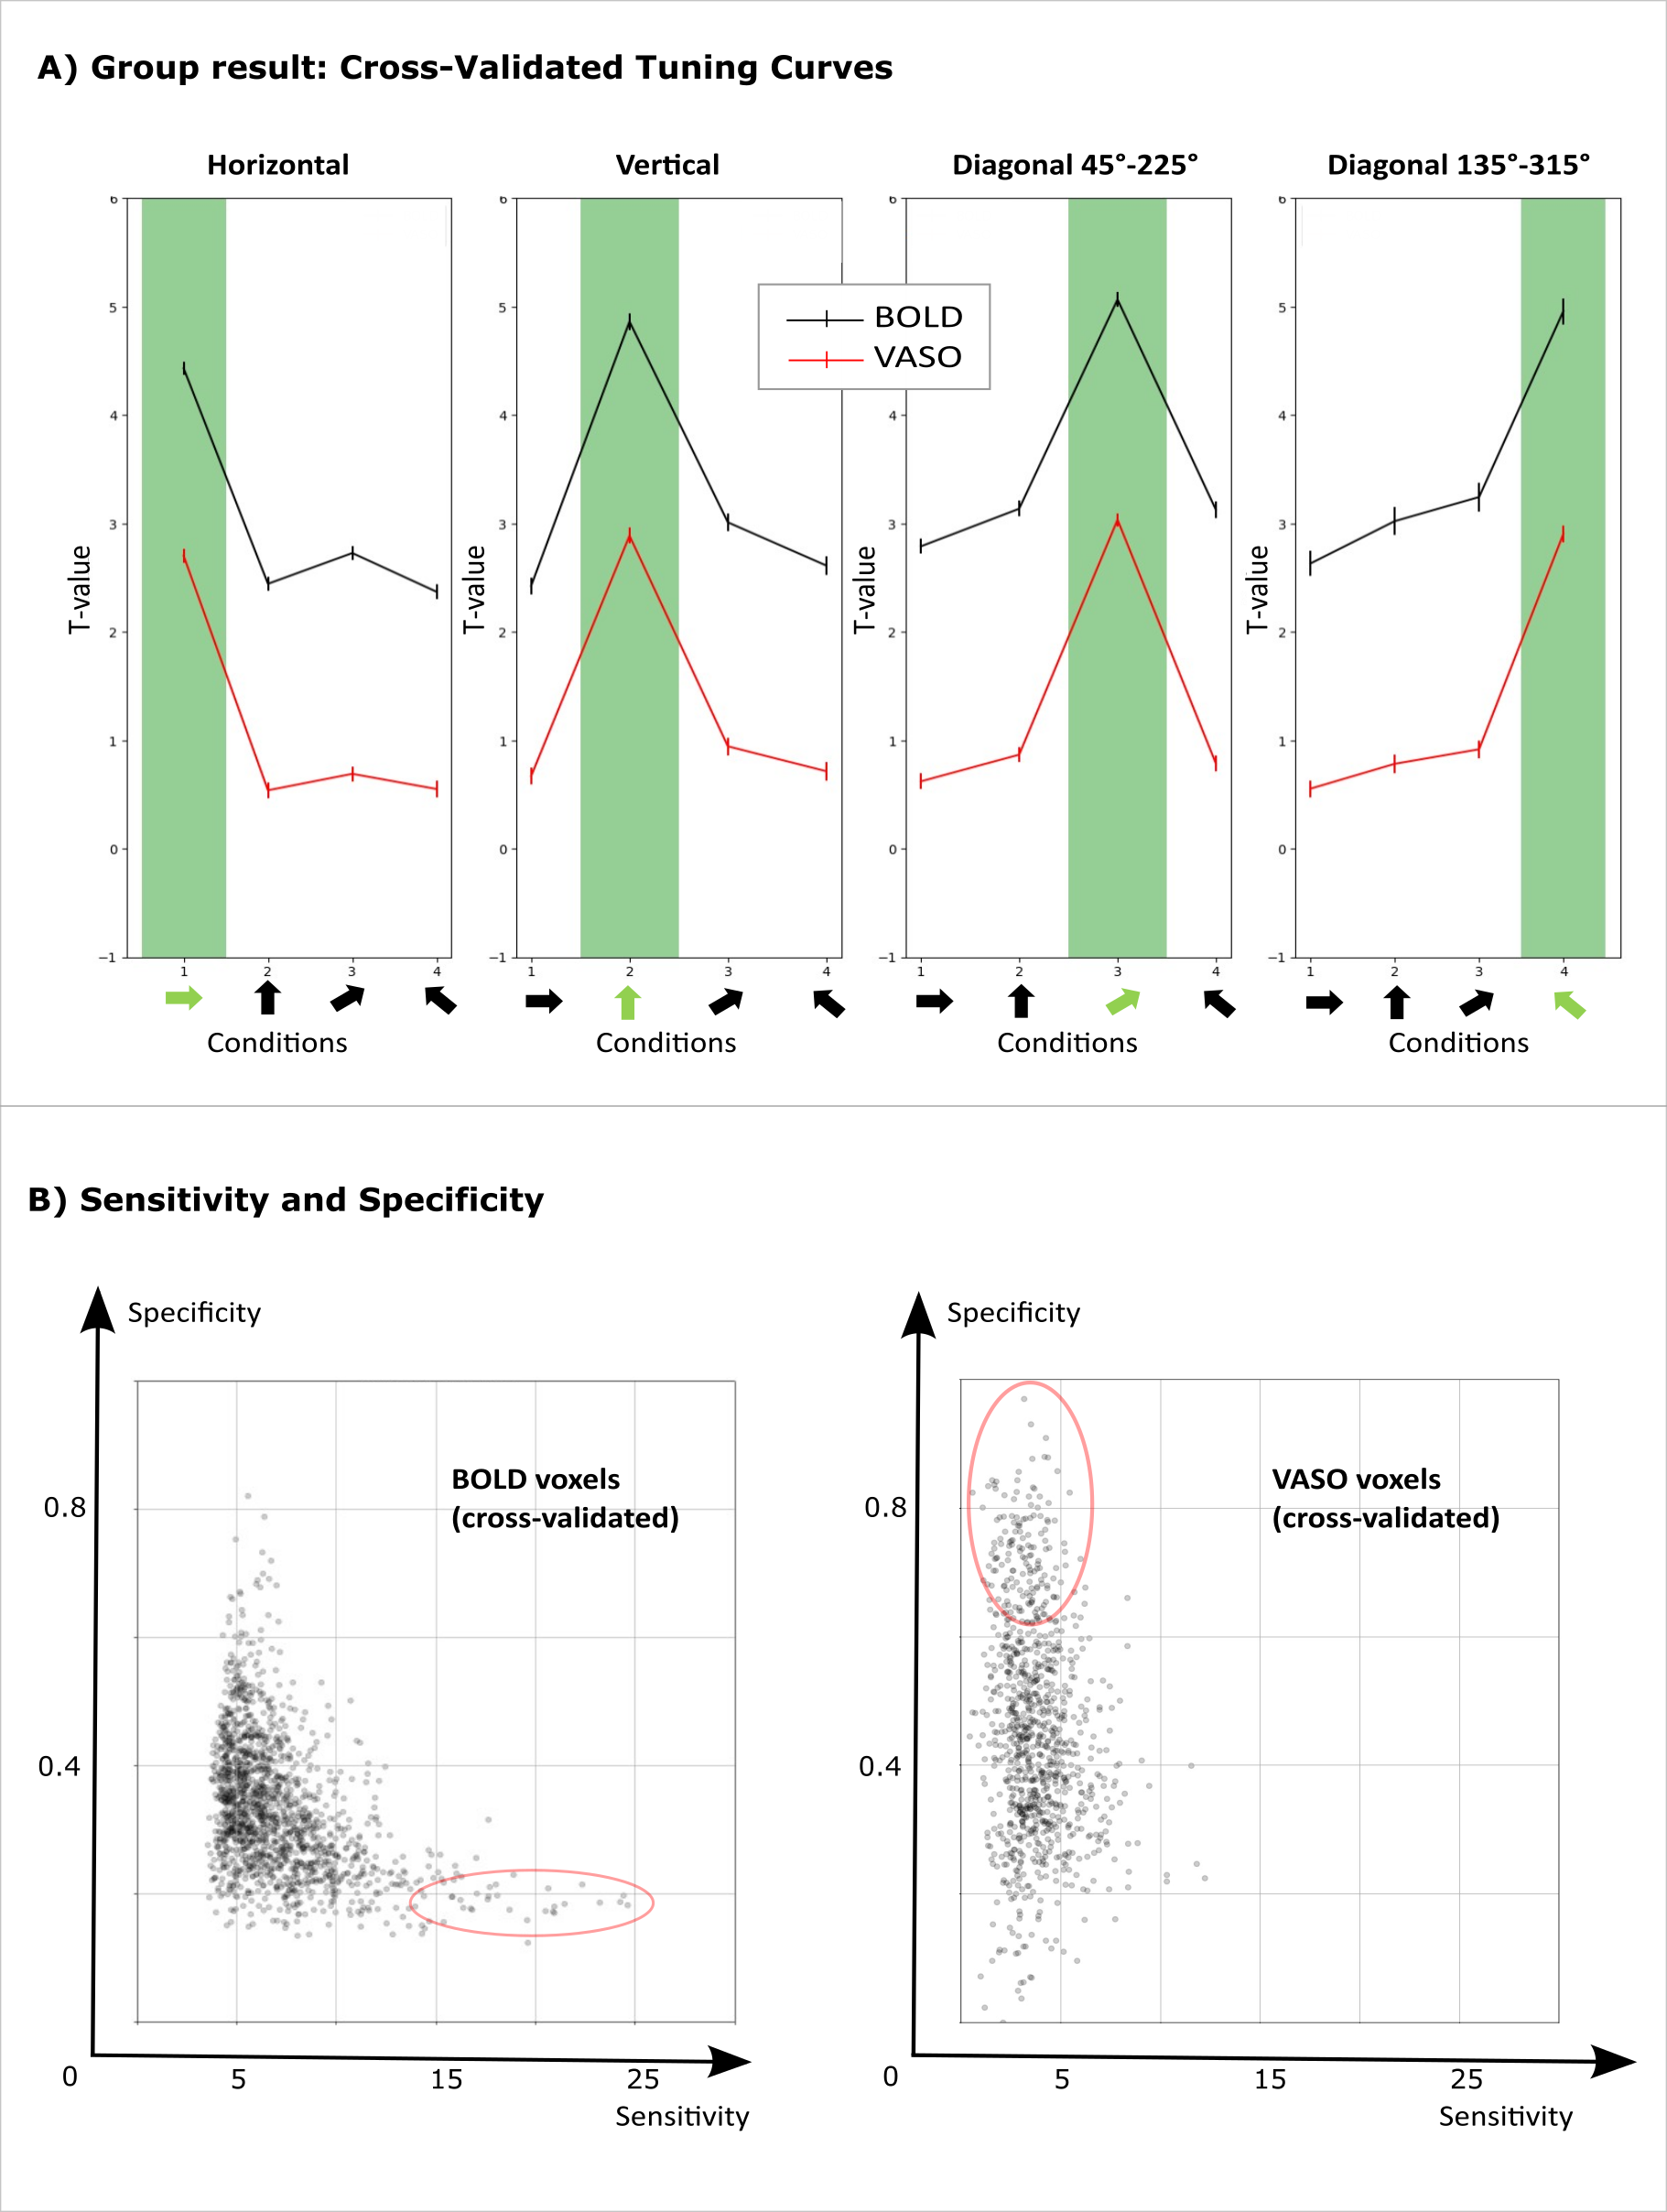
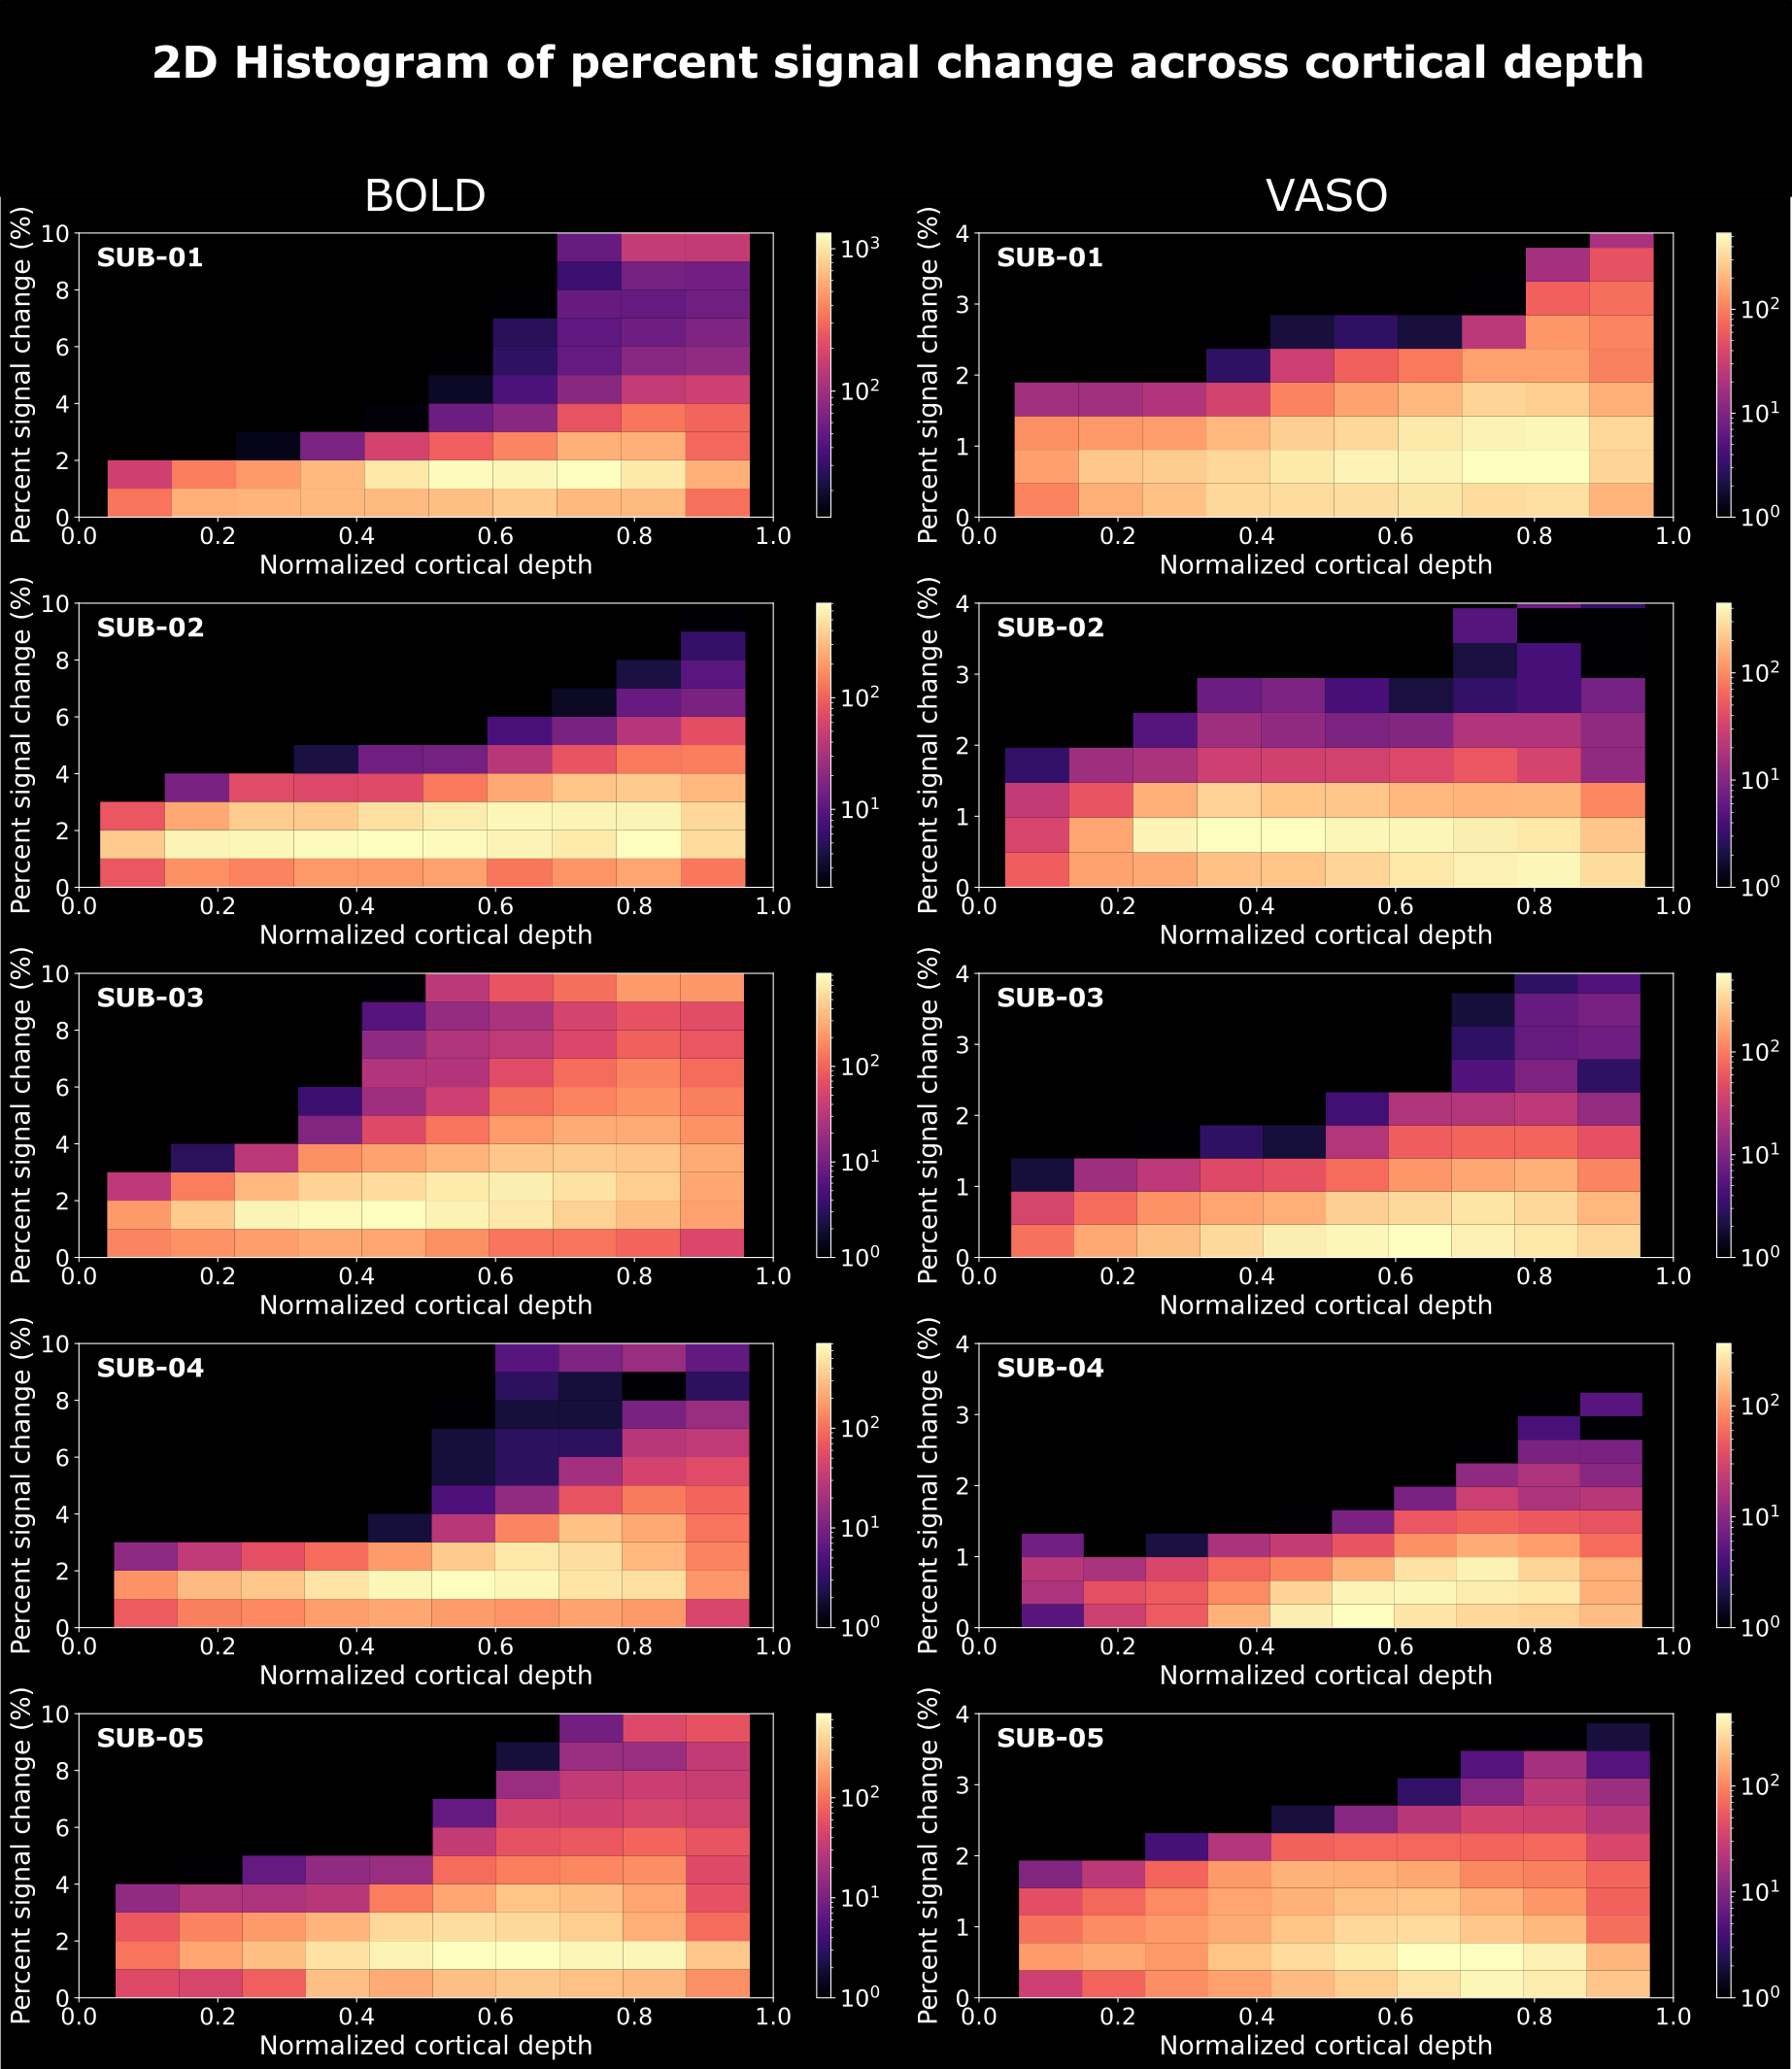
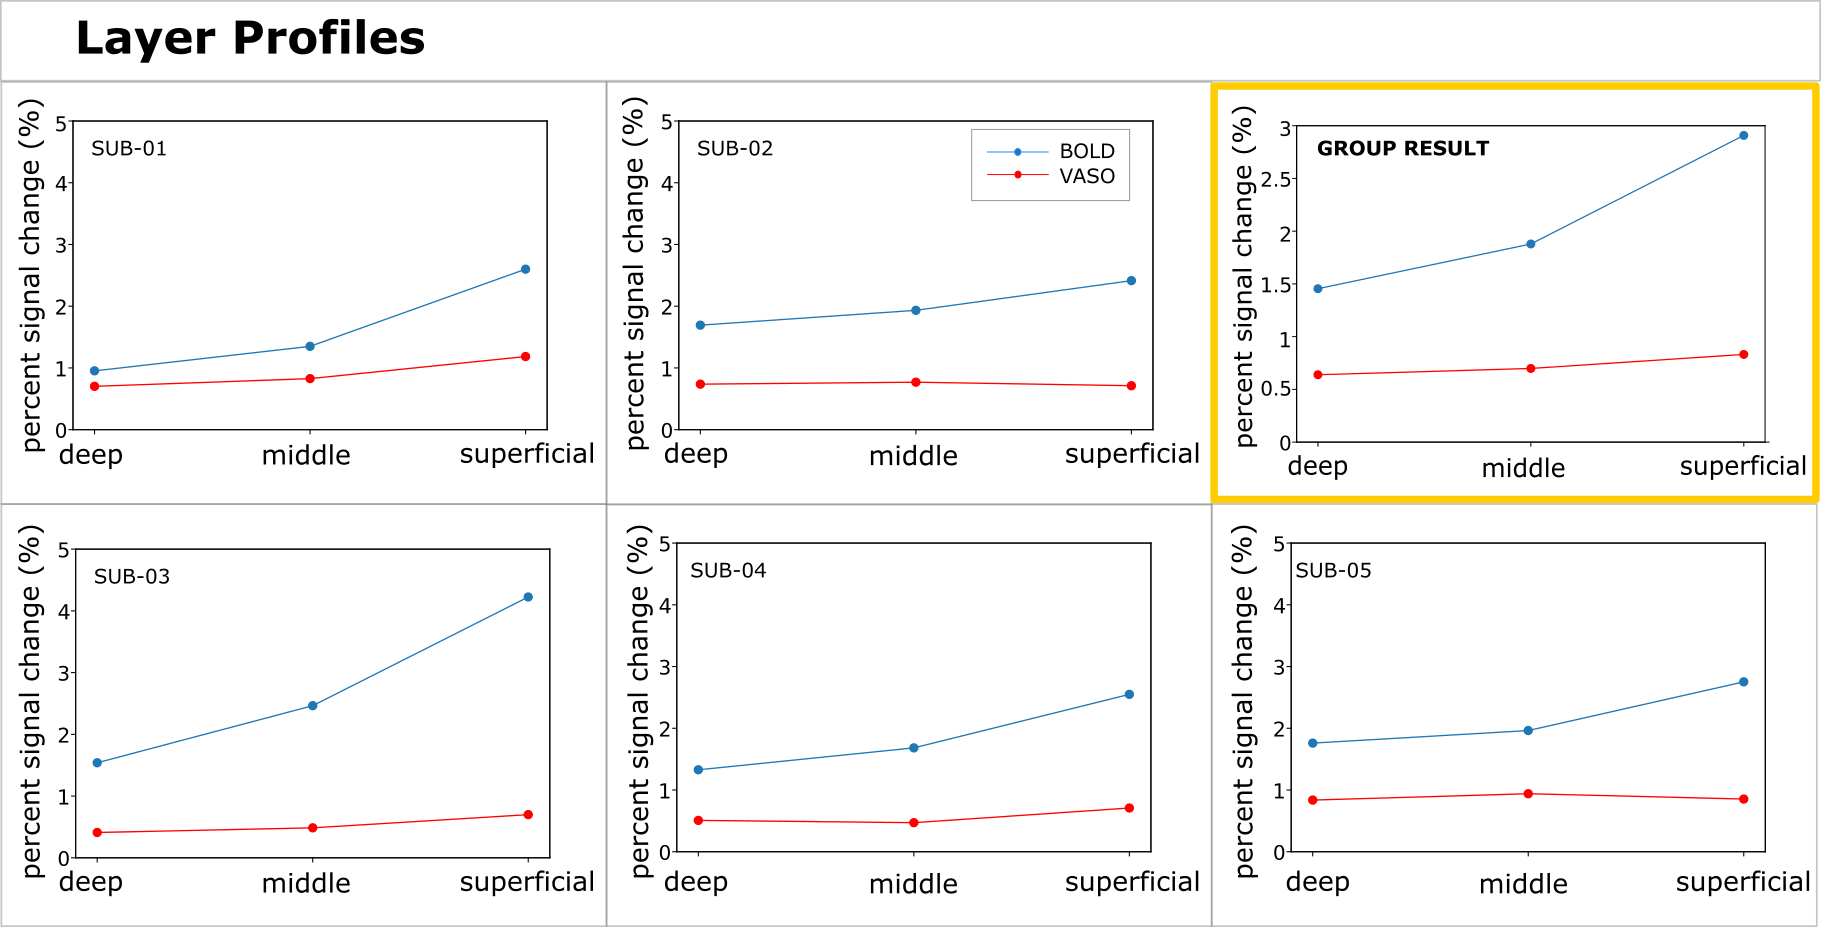
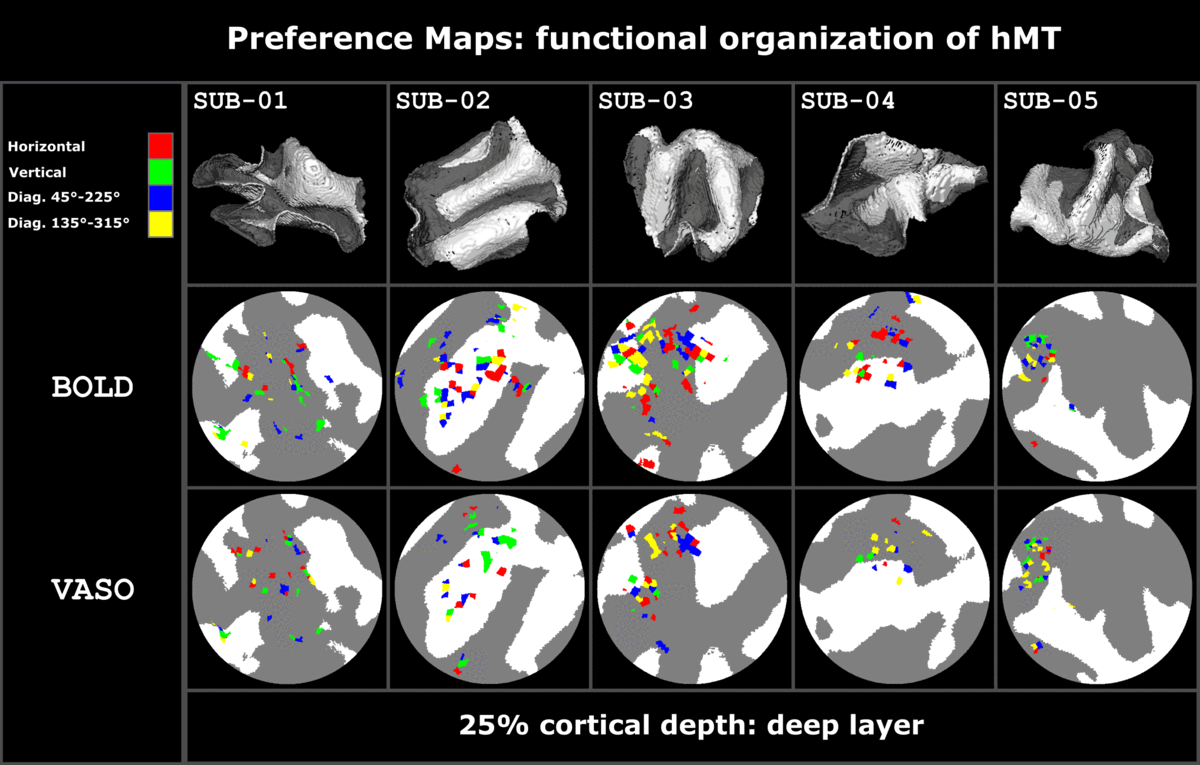
Five volunteers were scanned at a ‘classical’ MAGNETOM 7T (Siemens Healthineers) with a 32-channel Rx head coil (Nova) at Scannexus B.V. (Maastricht, Netherlands). We collected 3-4 functional runs at 0.8 mm iso-voxel resolution to map four different axes of motion using SS-SI VASO (3D EPI readout6, TR/TE/FA=2410ms/25ms/26+°, TI=1530ms, 26 slices, GRAPPA=3 and in-plane partial Fourier 6/8) while presenting 4 repetitions of moving dots (12s, each) in 4 different directions (0°-180°, 45°-225°, 90°-270°, 135°-315°), alternated with flickering dots (12s) (Figure 1, A shows the slab coverage). In the same session we collected a functional localizer run with GE-BOLD7 at 2 mm iso-voxel (TR/TE/FA=1000ms/22ms/55°, 57 slices and multi band factor=3) to locate area hMT presenting 28 repetitions of outward/inward motion of dots (10s), followed by static dots (10s) and an anatomical MP2RAGE8 (0.7mm iso; TR/TE=6000ms/2.39ms, TI=800ms/2750ms, FA=4°/5°, GRAPPA=3). Functional localizer data were processed as follows: slice time correction, motion correction, high-pass filtering, geometric EPI distortion correction (BrainVoyager), co-registration to the high-resolution VASO data (Syn, ANTS). A region of interest (ROI) for the left hMT was obtained combining significant voxels [p<0.00001] to the “moving vs static dots” contrast of the localizer run (using a General Linear Model) with a sphere centered around the activity (radius=16mm). Anatomical data were co-registered to the same space (SyN, ANTS), upsampled to 0.2 mm iso-voxel (AFNI) and segmented (FSL BET, FSL FAST, ITK-SNAP). On both motion corrected BOLD and VASO time series from SS-SI VASO, we evaluated the tSNR (Figure 1 B) and then ran a GLM (BrainVoyager) restricted to the hMT-ROI (Figure 1 C); the initial set of activated voxels obtained from the contrast map “all axes of motion vs flickering dots” was cross-validated using a leave-one-run out approach1,2. Motion direction preference was assigned for each voxel based on the maximum t-value in the vector of t-values resulting from contrasting each direction vs flickering dots (‘preference map’). A voxel-wise measure of sensitivity (norm of t-values vector) and specificity (averaged angle between winner t-value and the rest) was derived. Equi-volume normalized cortical depths and a flattening algorithm were used to investigate the laminar and columnar profile of hMT (LayNii LN2_LAYERS, LN2_MULTILATERATE, LN2_PATCH_FLATTEN)9,10.Results & Discussion
We found axes-of-motion specific tuning curves for all cross-validated voxels in all analyzed subjects for both BOLD and VASO contrast. Figure 2 A shows that for both BOLD and VASO a characteristic peak at the preferred axis of motion can be observed in the group result, showing that the averaged voxel response exhibits a clear preference towards a single axis of motion. Moreover, VASO shows a higher ratio of t-values between the preferred vs non-preferred axes confirming its higher specificity compared to BOLD (on average for VASO=4.1, for BOLD=1.7). Figure 2 B quantifies that BOLD cross-validated voxels are more sensitive in terms of the overall response strength, but less specific than VASO, as expected. We plot 2D histograms of cross-validated voxels showing percent signal change across cortical depth and layer profiles (Figure 3, 4): an overall lower mean and variance towards superficial layers is observed for VASO compared to BOLD, indicating that the draining vein effects on the pial surface are mitigated. Finally, Figure 5 visualizes preference maps of each subject across 3 cortical depths allowing the qualitative exploration of the columnar functional organization in hMT.Summary & Conclusion
This study shows for the first time the feasibility of measuring axes of motion and its laminar-columnar organization in extrastriate area hMT using SS-SI-VASO. As shown in Figure 2, voxel-specific selectivity for different axes of motion confirms previous results for BOLD and VASO contrasts. Despite the reduced signal sensitivity, VASO shows higher spatial specificity in comparison to BOLD contrast. In addition, unlike BOLD, the percent signal change for VASO data does not increase towards superficial layers in the layer profiles, indicating that the draining vein effects are mitigated as expected (Figure 3, 4). Further investigations are needed to quantify the functional columnar organization of hMT and highlight differences between the BOLD and VASO contrasts (Figure 5).Acknowledgements
● This project was funded by the EU-project H2020-860563 euSNN.
● This study was approved by the local ethics committee.
● RH was funded from the NWO VENI project 016.Veni.198.032.
● OFG is an employee of Brain Innovation and has financial interest tied to the company.
● RG has financial interest tied to Brain Innovation.
References
1. Schneider M, Kemper VG, Emmerling TC, De Martino F, Goebel R. Columnar clusters in the human motion complex reflect consciously perceived motion axis. PNAS 2019; vol. 116, no. 11. doi:10.1073/pnas.1814504116
2. Zimmermann J. et al. (2011), ‘Mapping the Organization of Axis of Motion Selective Features in Human AreaMT Using High-Field fMRI’. PLOS ONE. vol. 6, no. 12. doi:10.1371/journal.pone.0028716
3. Beckett AJS, Dadakova T, Townsend J, Huber L, Park S, Feinberg DA. Comparison of BOLD and CBV using 3D EPI and 3D GRASE for cortical layer functional MRI at 7 T. Magn Reson Med. 2020; 84(6):3128-3145. doi:10.1002/mrm.28347
4. Huber L, Uludag K, Moller HE. Non-BOLD contrast for laminar fMRI in humans: CBF, CBV, and CMRO2. Neuroimage. 2019; vol.197, pp. 742-760. doi:10.1016/j.neuroimage.2017.07.041
5. Lu H, Golay X, Pekar JJ, van Zijl PCM. Functional magnetic resonance imaging based on changes in vascular space occupancy. Magnetic Resonance in Medicine 2003; vol. 50, no. 2, pp. 263-274. doi:https://doi.org/10.1002/mrm.10519
6. Poser et al.,. Three dimensional echo-planar imaging at 7 tesla. Neuroimage. 2010;51(1):261-266. doi:10.1016/j.neuroimage.2010.01.108
7. Moeller S et. al. Multiband multislice GE-EPI at 7 tesla, with 16-fold acceleration using partial parallel imaging with application to high spatial and temporal whole-brain fMRI. Magnetic Resonance in Medicine 2010; vol. 63, no. 5, pp.1144-1153. doi:10.1002/mrm.22361
8. Marques JP et al. MP2RAGE, a self bias-field corrected sequence for improved segmentation and T1-mapping at high field. Neuroimage 2010; vol. 49, no. 2, pp. 1271-1281. doi:10.1016/j.neuroimage.2009.10.002
9. Huber L et al. LAYNII: A software suite for layer-fMRI. bioRxiv 2020; doi:10.1101/2020.06.12.148080
10. Gulban OF, Wagstyl K, Goebel R, Huber L (2021): Patch flattening for high resolution topographical surveys of MRI & histology without surface meshes. figshare. Conference contribution. https://doi.org/10.6084/m9.figshare.14813172.v1
Figures