2150
Measurement of End-to-End latency in real-time MRI1Institute for Diagnostic and Interventional Radiology of the University Medical Center Göttingen, Göttingen, Germany, 2Department of Pediatric Cardiology of the University Medical Center Göttingen, Göttingen, Germany, 3Institute of Medical Engineering, Graz University of Technology, Graz, Austria, 4DZHK (German Centre for Cardiovascular Research), Partner Site Göttingen, Göttingen, Germany, 5Goettingen Heart Center, University Medical Center Göttingen, Göttingen, Germany
Synopsis
For interventional MRI-guided applications image reconstruction should be without delay to avoid unwanted failure. Since latency is unavoidable it is very important to know it beforehand. For this reason, we present a new method to measure the latency of real-time MRI systems.
The main components are two inexpensive optical cameras. No modification of the scanner system is required. Different validations show that our method works reliably. Results from our RT MRI system provide insight into the latency of different protocols. We believe that we have found an inexpensive, easy, and robust way of determining RT MRI latency.
Introduction
The potential of MRI-guided catheter procedures was well-realized as early as the 1980s1. Due to many restrictions of MRI hardware and software, its applications were very limited in the beginning. But now with the advent of powerful gradients, surface coil arrays, and parallel imaging, expansion of clinical interventional MRI-guided catheter procedures are on the horizon2-5.For example, angioplasty and stent implantation procedures can be carried out under an MRI environment instead of X-rays. For such procedures, it is important for the physician to see his actions on the screen with minimal delay. For example, during a stent release at the target area, any delay can result in its wrong deployment.
Understanding and optimizing the latency of the Real-Time (RT) sequences beforehand is therefore important for further development of these applications. Here, we introduce a new flexible method, allowing continuous, in-situ measurement of end-to-end latency.
Methods
The schematic diagram of our latency measurement setup is shown in Figure 1. It consists of two microcontroller boards (ESP32-CAM, distributed by Joy-IT, Neukirchen-Vluyn, Germany) with WiFi connectivity, camera modules, microsecond-precision timers, and a phantom. The phantom is built in a way that the motion of the sample is visible for both to direct visual perception and in MR images (Figure 2).
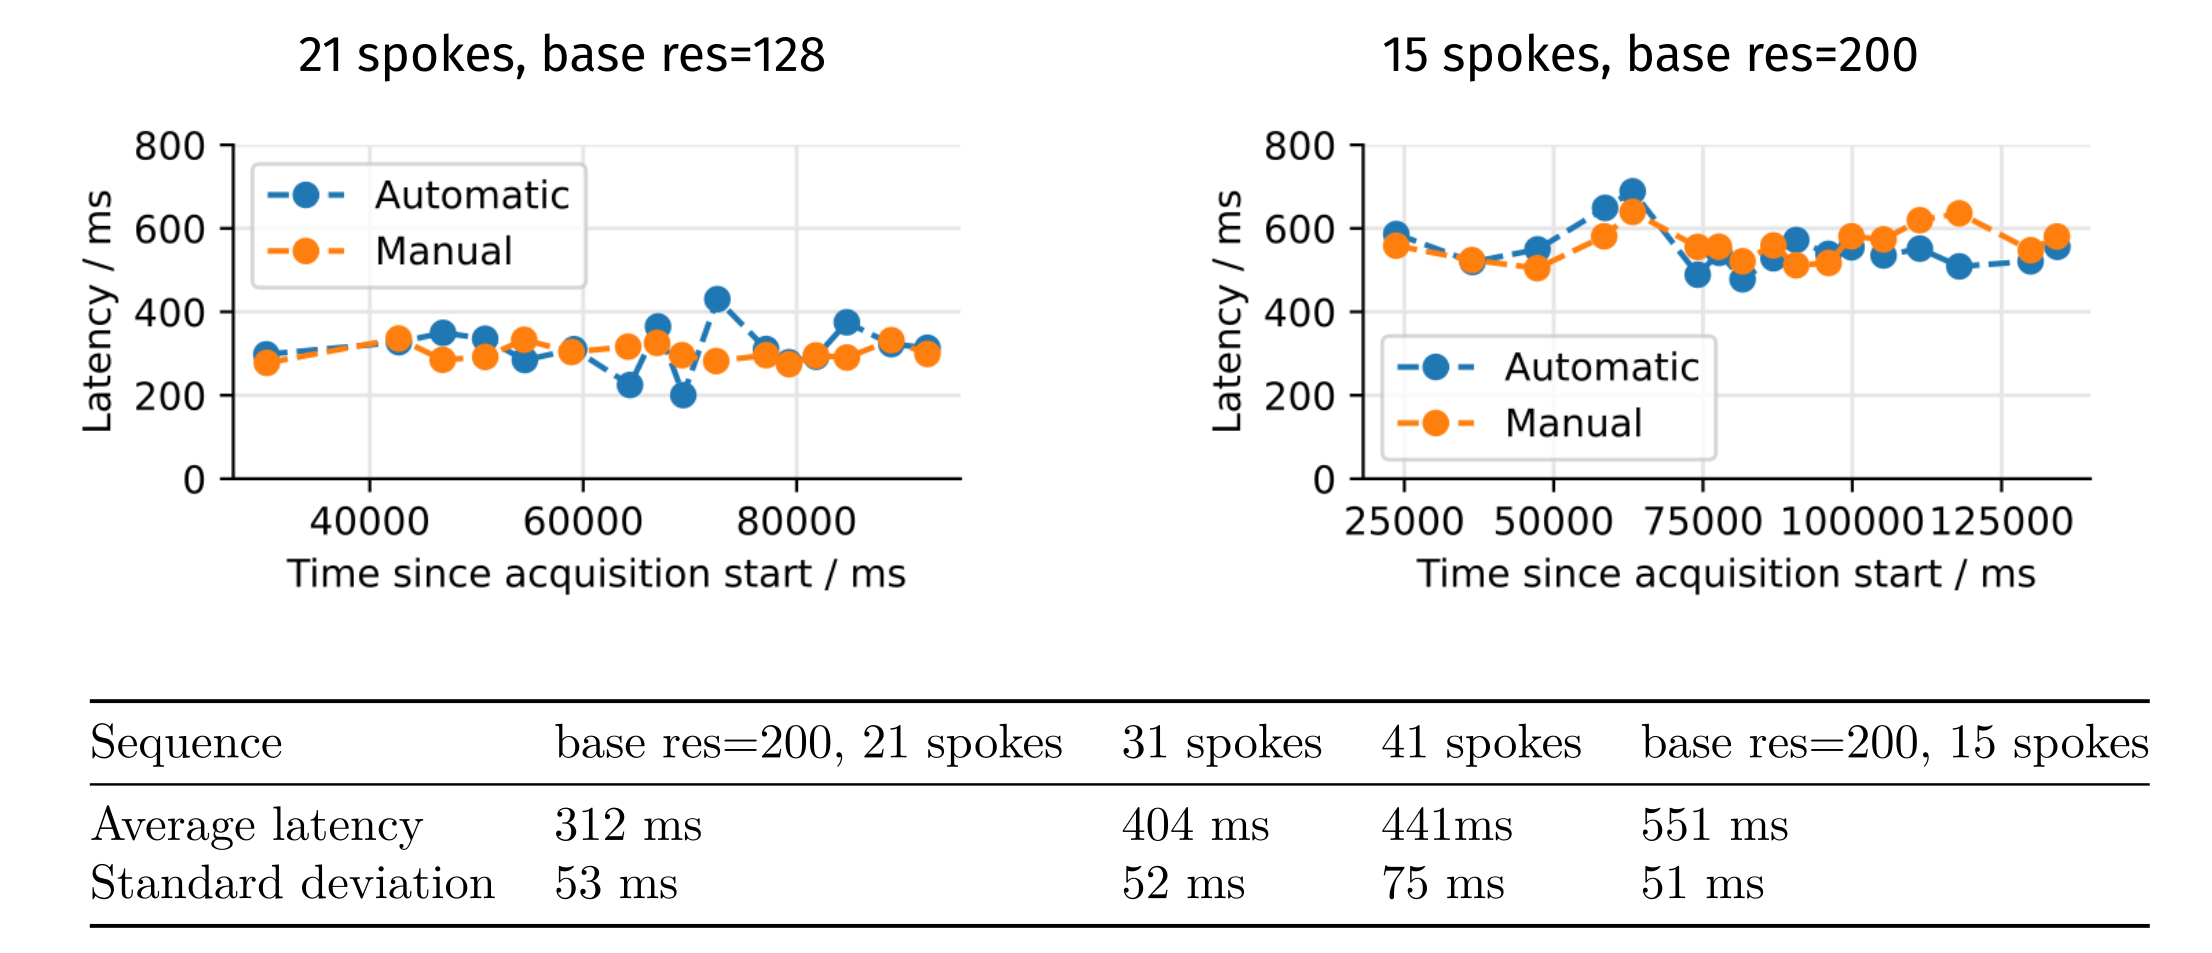
The measurements are performed on a Skyra 3T Scanner (Siemens Healthcare GmbH, Erlangen, Germany) using a radial bSSFP (TE/TR=1.71/3.42 ms, base resolution=200, 15 spokes) and a radial FLASH (TE/TR=1.3/2.02 ms, base resolution 128, 21/31/41 spokes) sequence.
Reconstruction by means of regularized non-linear inversion6 (NLINV) with 5 iterations on a Multi-GPU system7 allows displaying the images in real-time on the in-room screen (NordicNeuroLab).
One camera is mounted inside the bore to record the motion in the scanner. The other camera records the in-room screen showing the MRI video. Data from both cameras is streamed to a computer and saved along with precise timestamps. The resulting videos are processed by calculating the consecutive differences between two frames. A delay between the two videos is then determined using the cross-correlation of the norm of the difference images over a selected Region of Interest (ROI).
The correlation is determined on a window of 70 frames every time a motion happens, which can be detected from peaks in the processed signals. Using the timestamps from the internal timers, spurious variations in the frame rates of the cameras are recorded. As these might affect the estimated latency, frames from periods during which the frame rate varied were rejected.
In addition to this automatic method, we also perform manual identification of frames showing the same event. The latencies obtained from the two streams are corrected to include the offsets of the internal timers. This is done by recording a single event directly with both cameras before and after the MRI measurement.
Results
As a first result, we determined the offset between the timers of the two microcontrollers from the calibration measurement.We found an offset of 200182.8 ms from the measurement before the MRI scan and 200184.0 ms from synchronisation after the scan. These measurements were separated by 44 minutes. The difference of 1.2 ms is well below the time between two frames, which varied between 34 and 40 ms. This shows sufficient accuracy of the hardware.
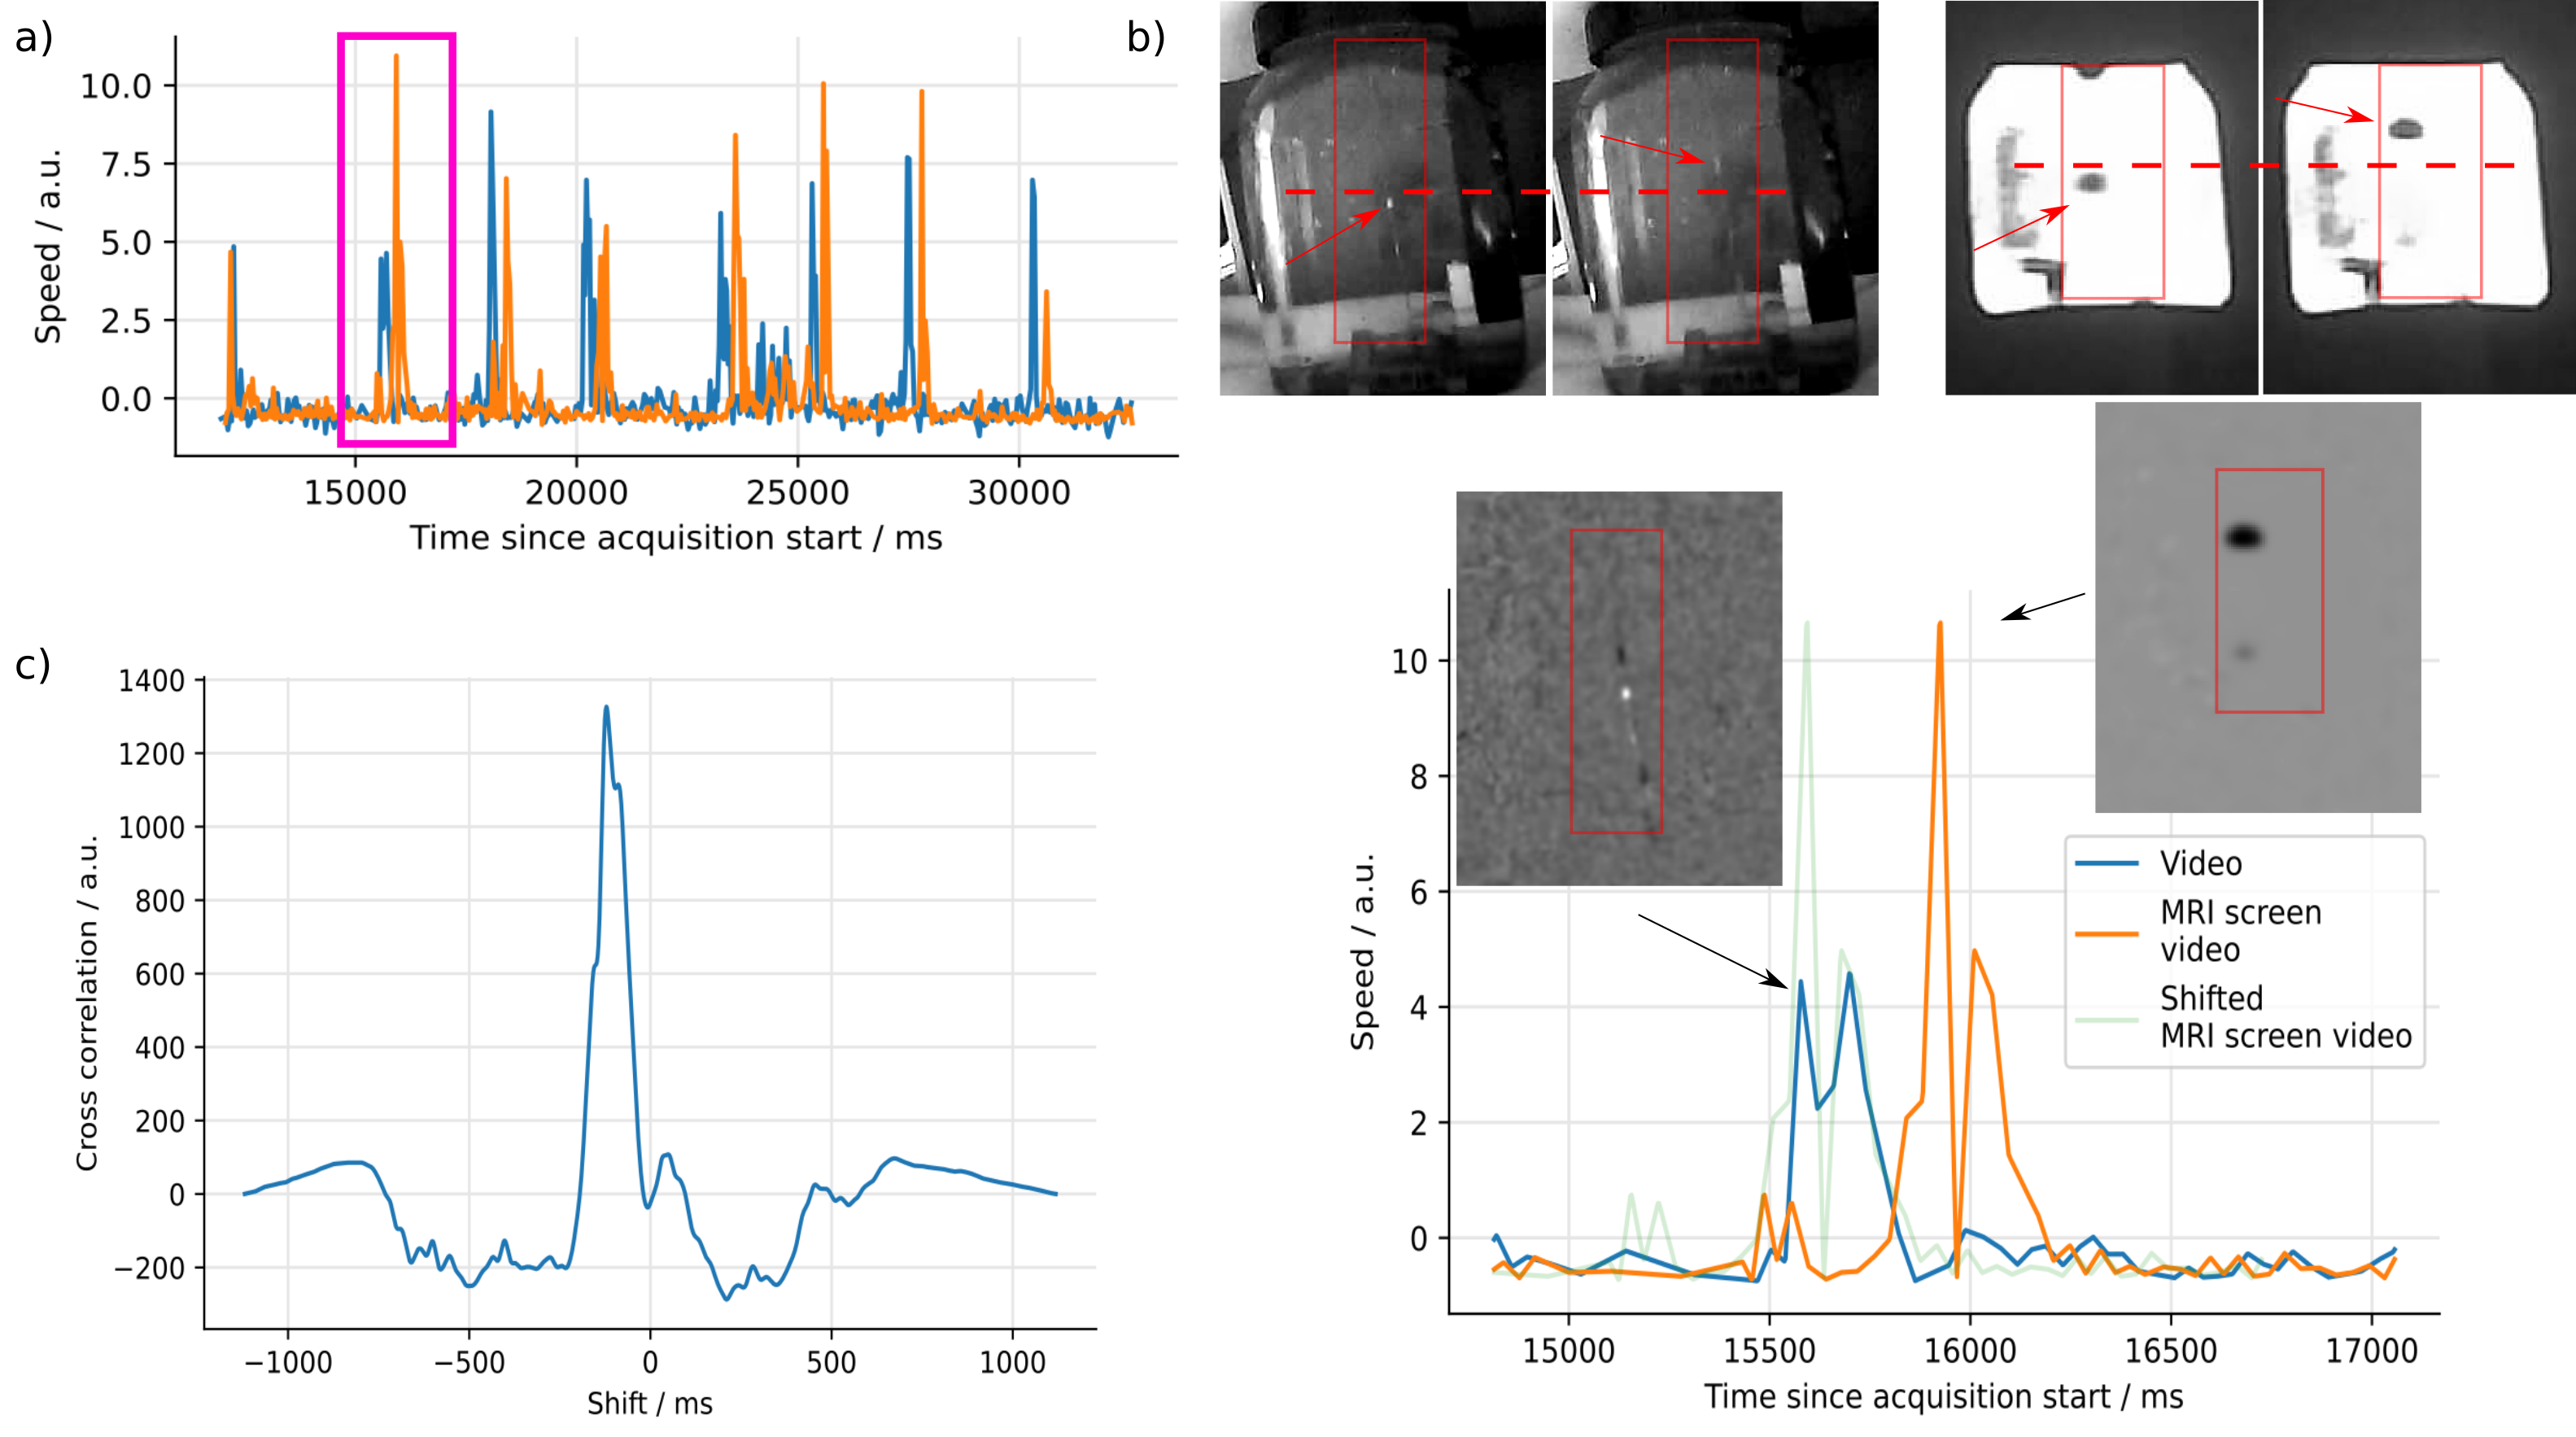
Figure 3 shows first results from our phantom experiment with a real-time radial FLASH sequence with 21 spokes and NLINV reconstruction on GPUs.
Motion of the test sample can be clearly seen as a peak in both signals. Over the course of one minute, 16 motion events were detected and processed, yielding a series of latency estimates.
Correcting the offset between the two timers, at our first motion we find a delay time of 331 ms and 347 ms using the automatic and manual methods, respectively.
A comparison of with manual delay estimation gives very similar latencies, confirming the automated latency estimation approach. This is shown in Figure 4, along with further results from experiments with different base resolutions and numbers of spokes.
Discussion
We present a simple and robust method to measure the end-to-end latency of RT MRI setup using two inexpensive optical cameras and a tube containing passive MRI markers.The two cameras simultaneously record the live motion of the sample inside the phantom and on the MRI screen.
After correcting the time shift between the time stamps of the cameras, the latencies of real-time sequences are determined with an automated and a manual method. The accuracy of the method is influenced by the frame rate of the cameras. However by considering random motions over sufficient lengths of time, very precise measurements can be made.
To demonstrate the feasibility of our method, we analyzed some of our RT MRI sequences and determined differences in the latencies between different measurement protocols with different spatial and temporal resolution. In summary, the described setup provides reliable tool to estimate end-to-end latency that not only includes reconstruction time but also all other delays of the complete imaging pipeline.
Acknowledgements
Supported by the DZHK (German Centre for Cardiovascular Research).References
[1]: Blanco Sequeiros, R., Ojala, R., Kariniemi, J., Perälä, J., Niinimäki, J., Reinikainen, H., & Tervonen, O. (2005). MR-guided interventional procedures: a review. Acta Radiologica, 46(6), 576-586.[2]: Unterberg-Buchwald, C., Ritter, C. O., Reupke, V., Wilke, R. N., Stadelmann, C., Steinmetz, M., ... & Uecker, M. (2017). Targeted endomyocardial biopsy guided by real-time cardiovascular magnetic resonance. Journal of Cardiovascular Magnetic Resonance, 19(1), 1-10.
[3]: Nageotte, S. J., Lederman, R. J., & Ratnayaka, K. (2020). MRI catheterization: ready for broad adoption. Pediatric cardiology, 41(3), 503-513.
[4]: Reddy, S. R. V., Arar, Y., Abou Zahr, R., Gooty, V., Hernandez, J., Potersnak, A., ... & Hussain, T. (2020). Invasive cardiovascular magnetic resonance (iCMR) for diagnostic right and left heart catheterization using an MR-conditional guidewire and passive visualization in congenital heart disease. Journal of Cardiovascular Magnetic Resonance, 22(1), 1-11.
[5]: Uecker, M., Zhang, S., Voit, D., Karaus, A., Merboldt, K. D., & Frahm, J. (2010). Real‐time MRI at a resolution of 20 ms. NMR in Biomedicine, 23(8), 986-994.
[6]: Schaetz, S., Voit, D., Frahm, J., & Uecker, M. (2017). Accelerated computing in magnetic resonance imaging: Real-time imaging using nonlinear inverse reconstruction. Computational and mathematical methods in medicine, 2017.
Figures
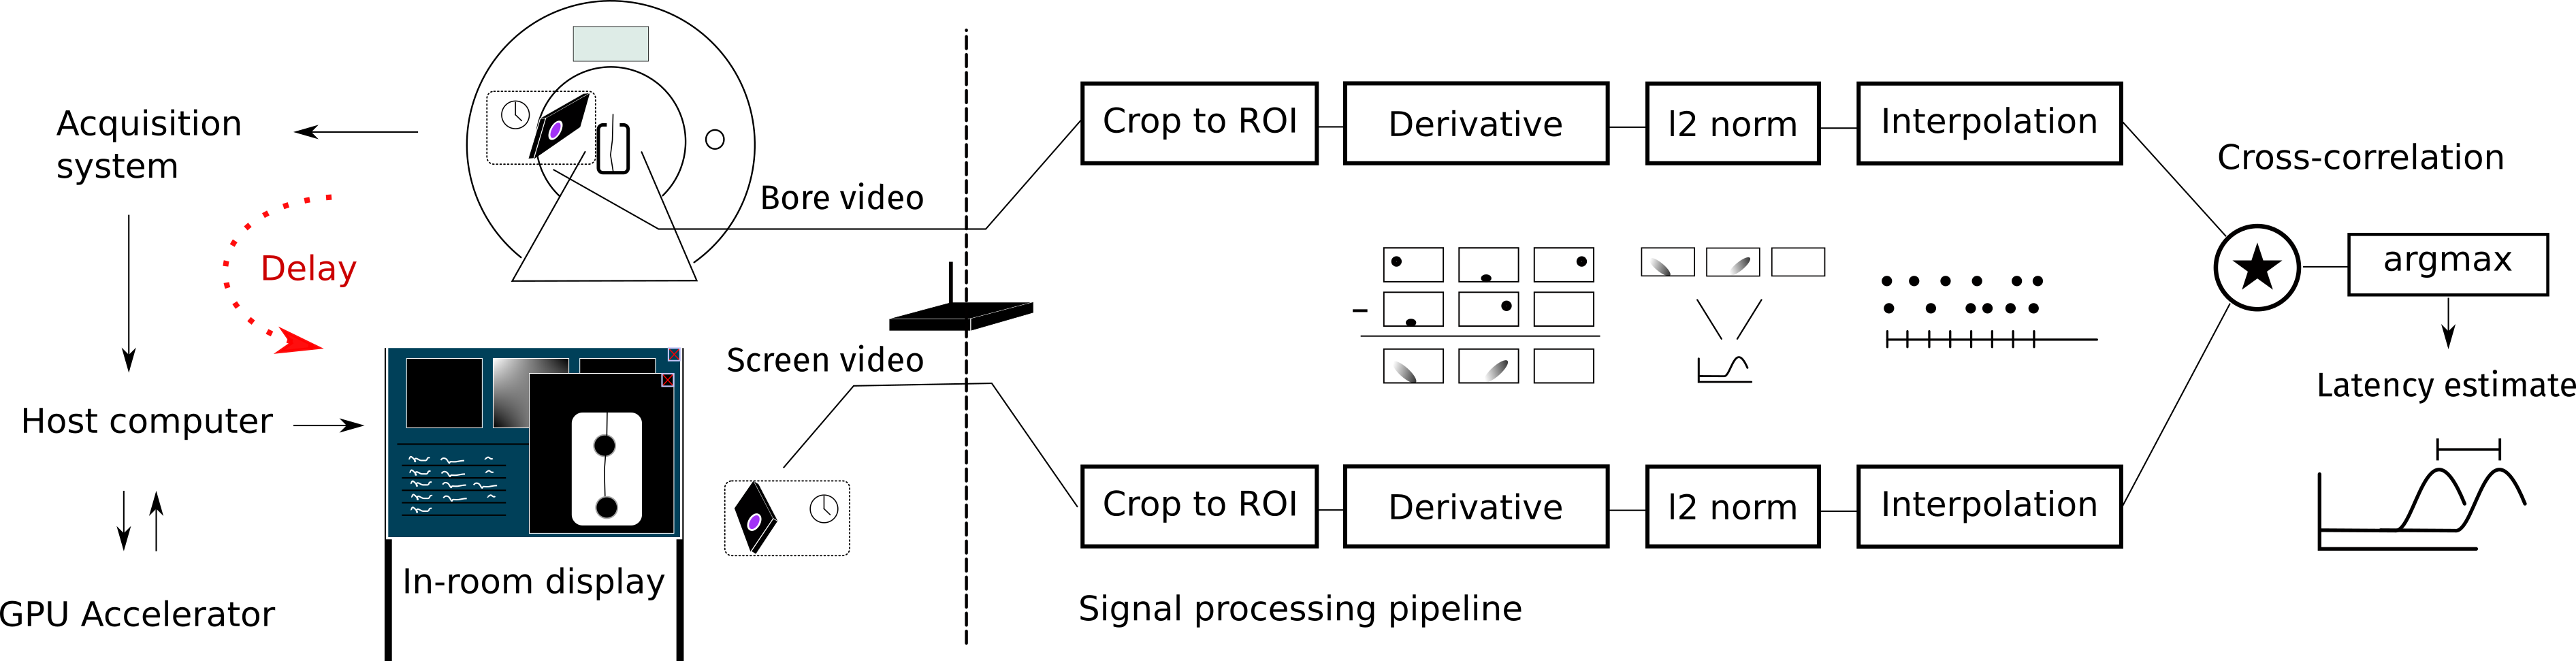
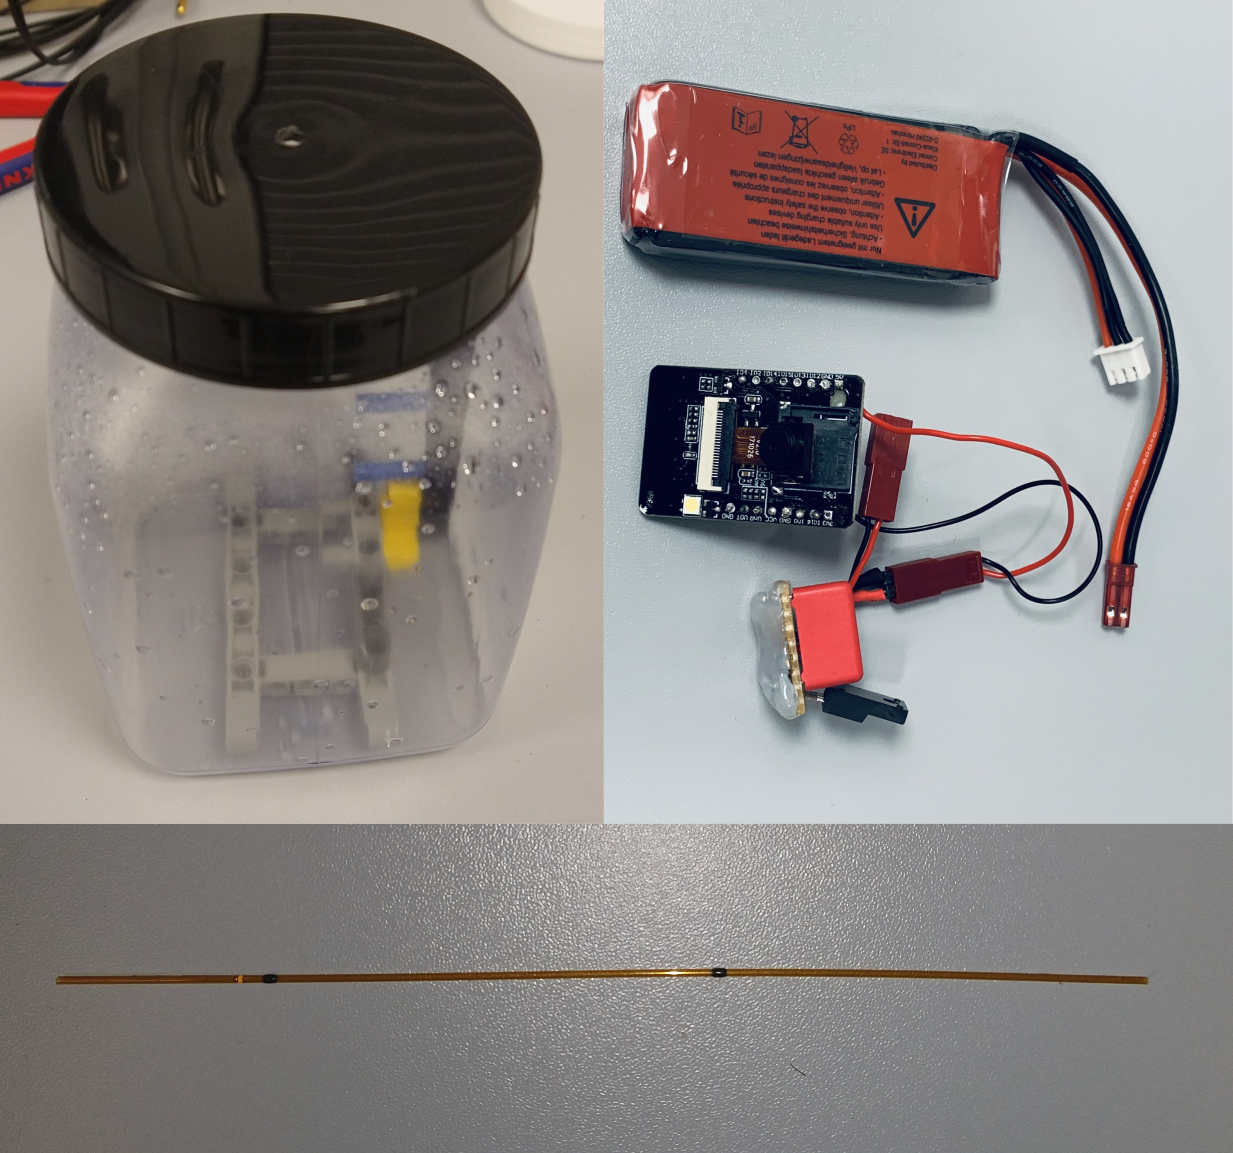
Figure 2: On the top right, a camera module is visible powered with a Lithium polymer battery. Designed for the "Internet of Things", similar devices are widely available at very affordable prices. The camera module was not MR compatible but minor modifications enabled it to function inside the magnetic bore.
The phantom shown on the top left consists of some reference markers and will be filled with water. A test sample can be easily moved in the phantom. The test sample is shown at the bottom and is equipped with passive MRI markers (black spots). As for an optical marker, white tape is used.